Fig. 4
Download original image
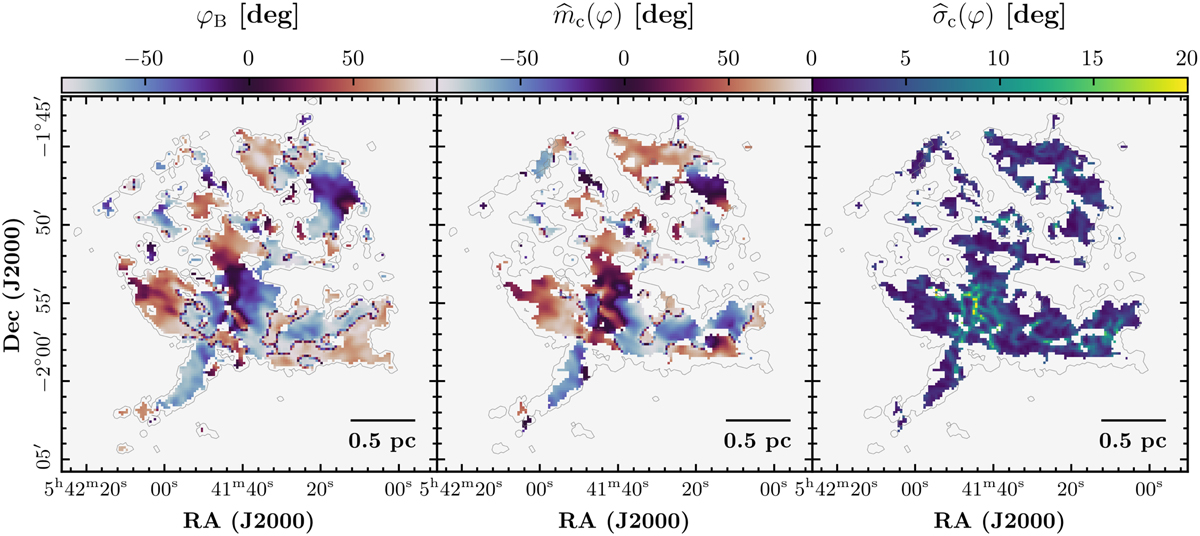
Direction of the magnetic field (left panel), the mean angle of the magnetic field (middle panel), and the rms of the magnetic field direction (right panel). Maps in the middle and right panels have been made using a 12 × 12 pixels sliding window with weight inversely proportional to the measured uncertainty variance. All maps have been regridded to match the grid size of the CN and HCO+ data. The gray contour indicates the mask we defined for dust polarization measurements, described in Sect. 2.1.
Current usage metrics show cumulative count of Article Views (full-text article views including HTML views, PDF and ePub downloads, according to the available data) and Abstracts Views on Vision4Press platform.
Data correspond to usage on the plateform after 2015. The current usage metrics is available 48-96 hours after online publication and is updated daily on week days.
Initial download of the metrics may take a while.