Fig. 3
Download original image
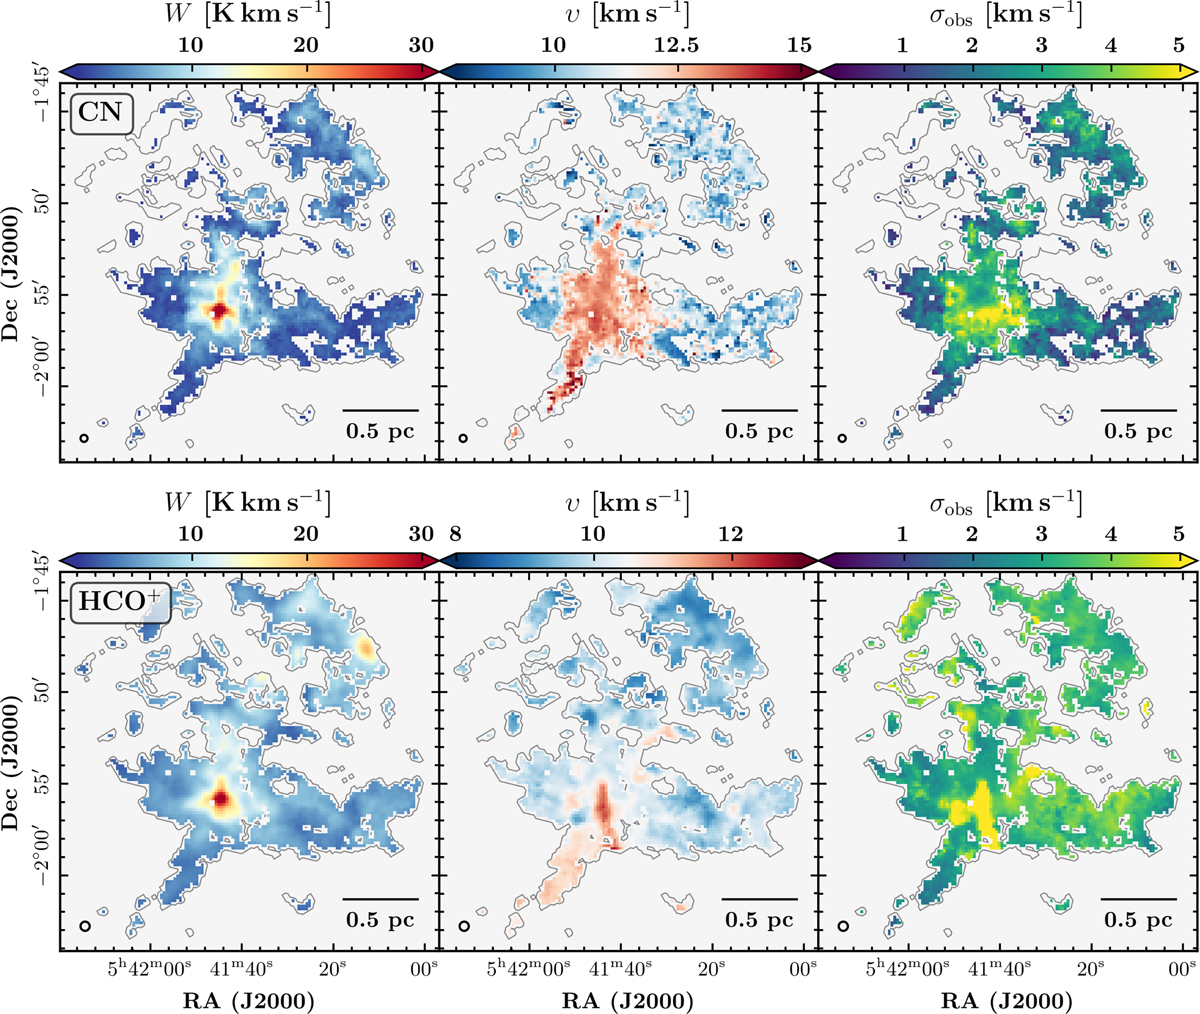
Moment maps of 12CN(1−0) and HCO+ (1−0) emission across NGC 2024. Top: maps of the CN emission: integrated intensity (the zeroth moment, left panel), the centroid velocity (the first moment, middle panel), and the FWHM (the second moment, right). Bottom: the same as in the top row, but for HCO+. We show the beam size for both molecular lines at the bottom left corner of each panel and the 0.5 pc scalebar at the bottom right corner. All pixels shown in these maps result from the masking technique presented in Einig et al. (2023). We refer the reader to the description of the production of these moment maps in Sect. 4.1.
Current usage metrics show cumulative count of Article Views (full-text article views including HTML views, PDF and ePub downloads, according to the available data) and Abstracts Views on Vision4Press platform.
Data correspond to usage on the plateform after 2015. The current usage metrics is available 48-96 hours after online publication and is updated daily on week days.
Initial download of the metrics may take a while.