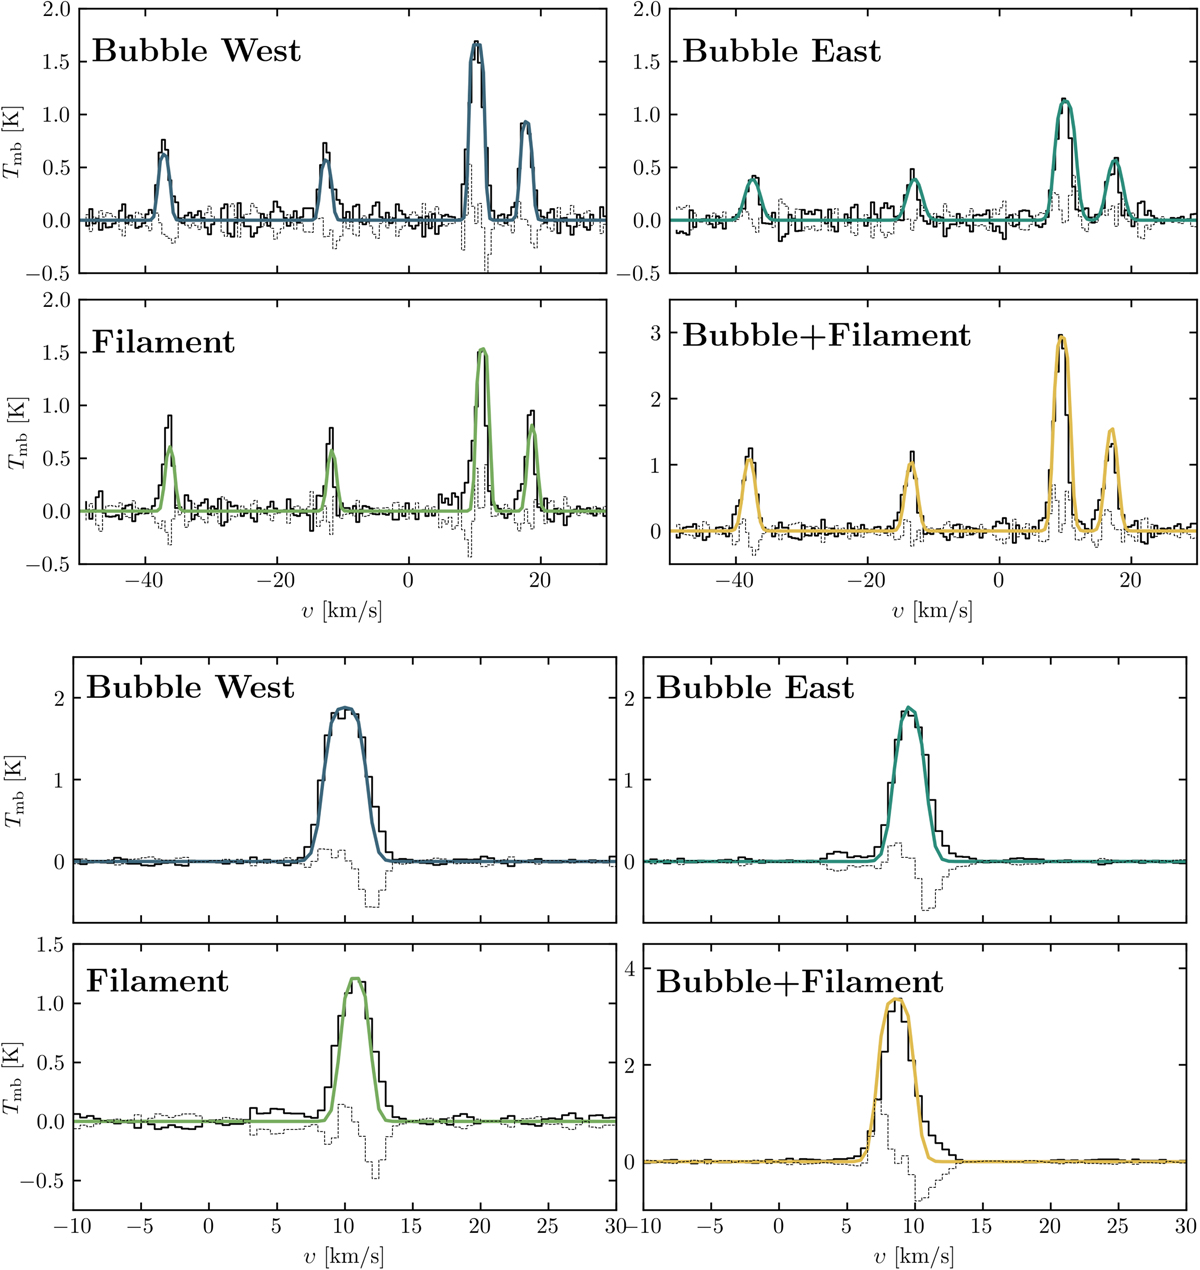
Fig. C.9
Download original image
Beam averaged spectrum of CN and HCO+ taken within four different regions shown in the left panel of Fig. 1 and in Fig. 2. Colored line represent the corresponding model spectrum infrerred from the non-LTE RADEX modeling for physical conditions presented in Sec. C and shown in Table 3. Dashed lines show the corresponding residuals.
Current usage metrics show cumulative count of Article Views (full-text article views including HTML views, PDF and ePub downloads, according to the available data) and Abstracts Views on Vision4Press platform.
Data correspond to usage on the plateform after 2015. The current usage metrics is available 48-96 hours after online publication and is updated daily on week days.
Initial download of the metrics may take a while.