Fig. 2
Download original image
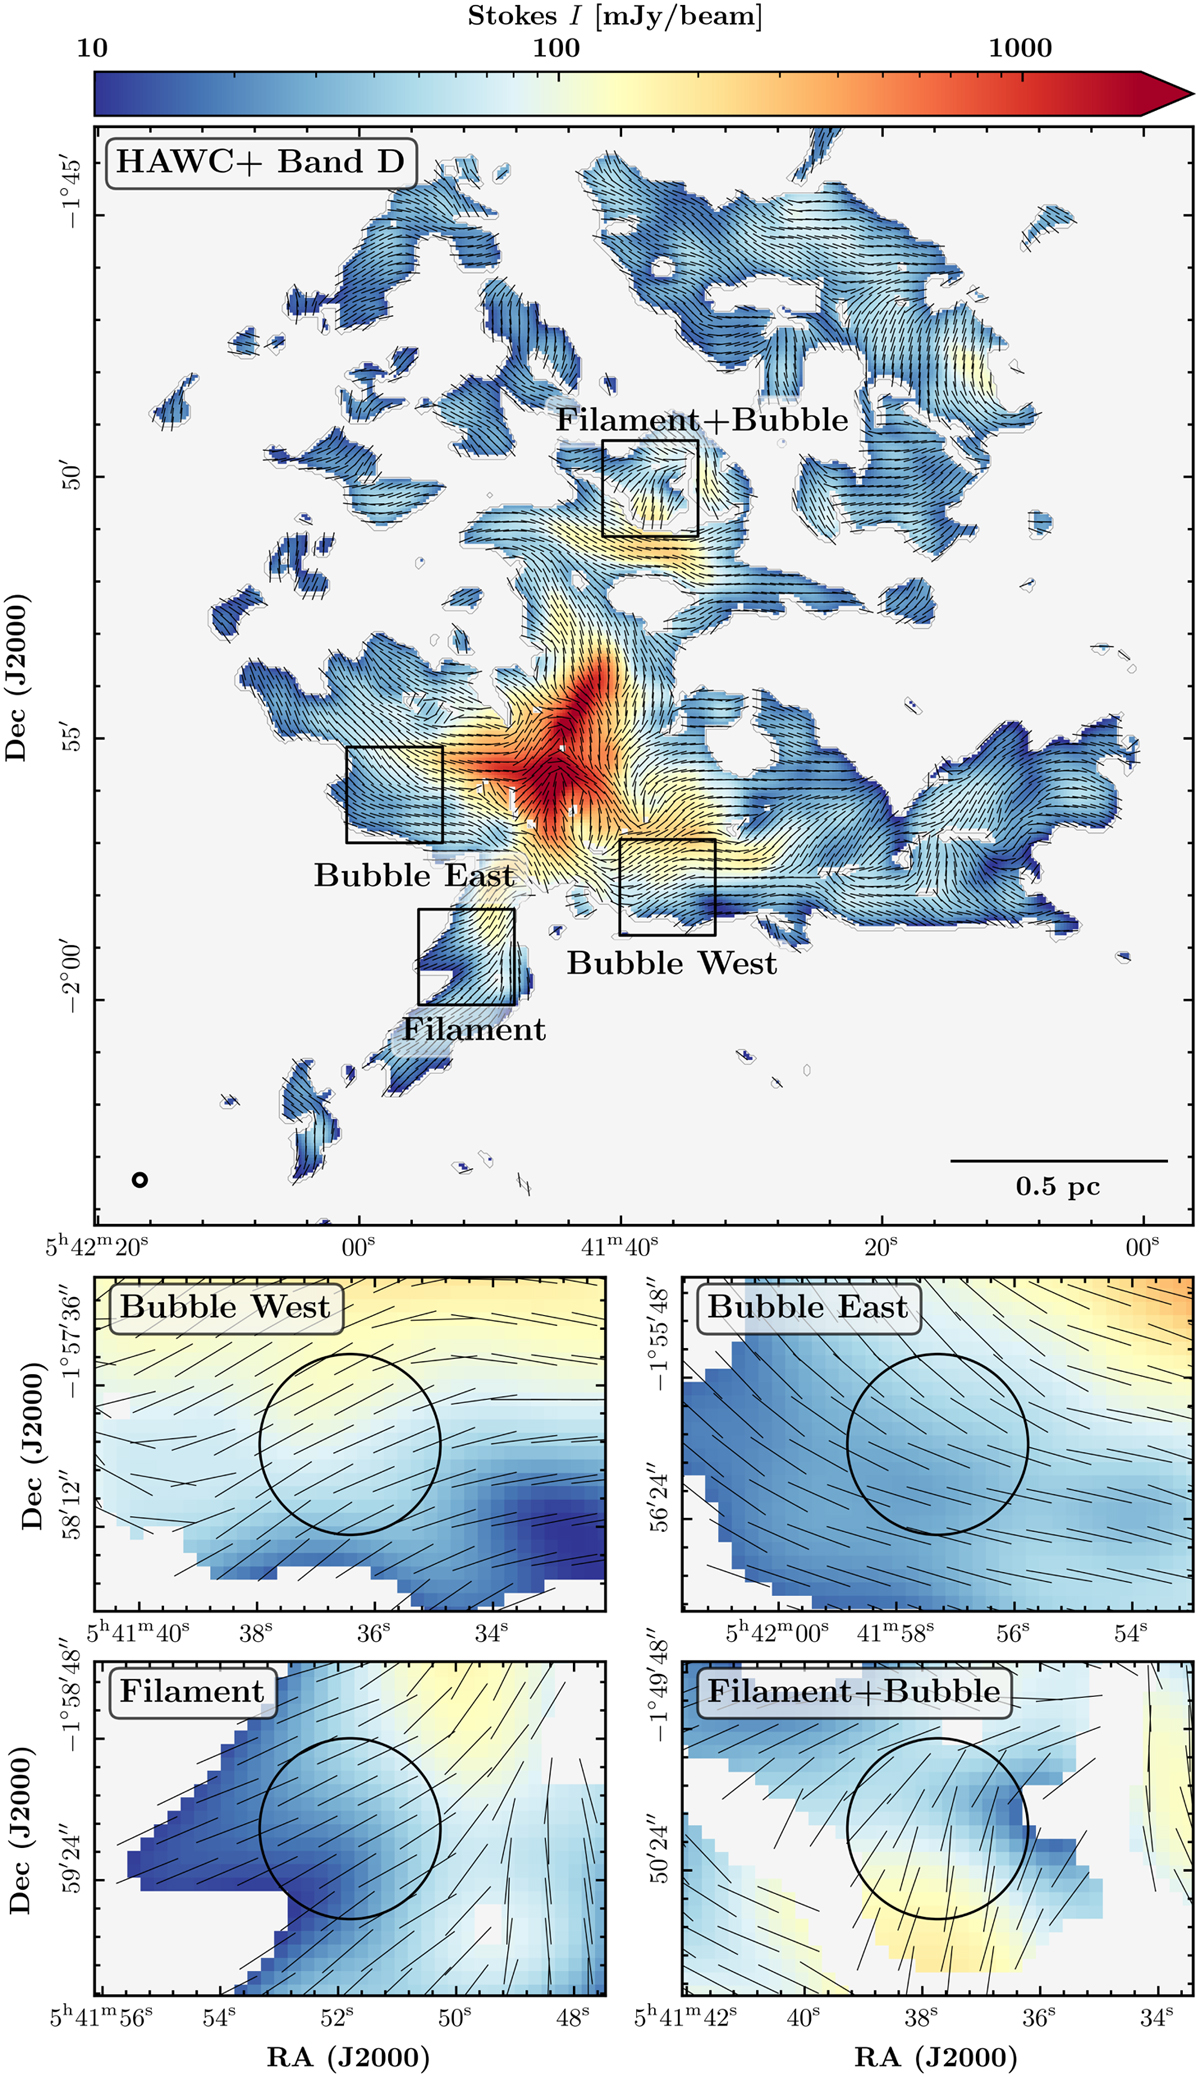
SOFIA HAWC+ 154 μm (Band D, all panels) dust continuum maps at 13.6″ angular resolution. The maps are masked based on the measured S/N in measured Stokes intensity and polarization angle. Black lines in all panels show the orientation of the magnetic field for every fifth pixel. We show Band D dust polarization map across NGC 2024 (top panel). Bottom rows show the zoomed-in regions we analyse in this work: egde of the bubble on the western (middle left panel), eastern (middle right panel), in the filament (bottom left panel), and in the overlap region of the filament and bubble (bottom right panel). A circle in each of these zoomed-in panels shows the region we use to compute the dispersion in the mean angle of magnetic field, as well as number density and turbulent velocity dispersion.
Current usage metrics show cumulative count of Article Views (full-text article views including HTML views, PDF and ePub downloads, according to the available data) and Abstracts Views on Vision4Press platform.
Data correspond to usage on the plateform after 2015. The current usage metrics is available 48-96 hours after online publication and is updated daily on week days.
Initial download of the metrics may take a while.