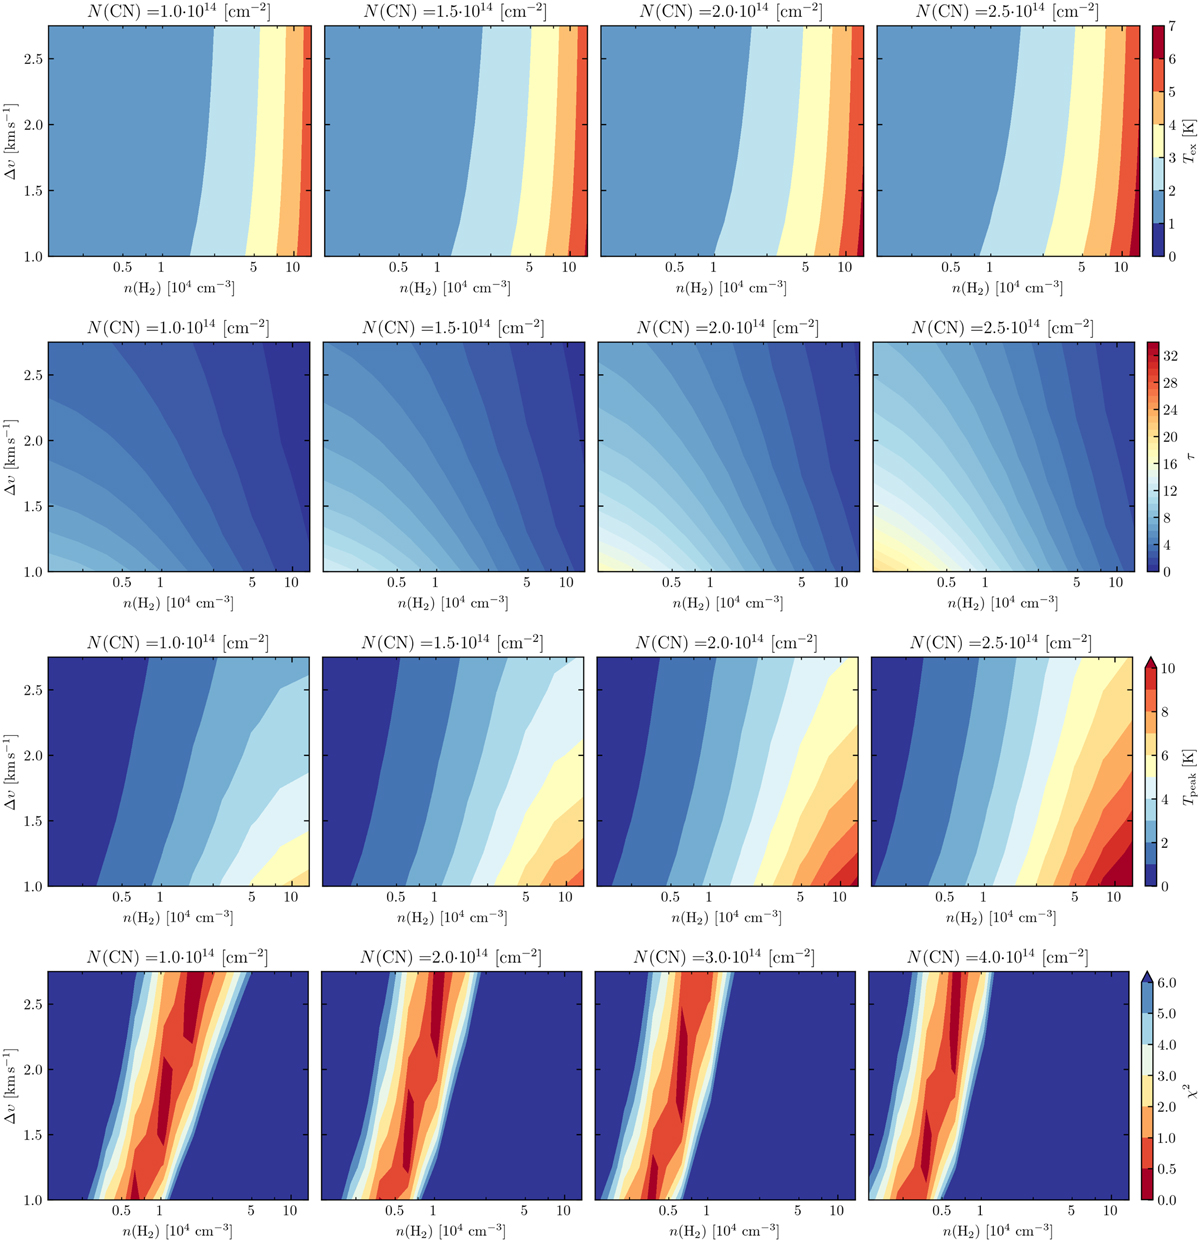
Fig. C.1
Download original image
Parameter space used for the radiative transfer modeling of CN in the region at the western side of the bubble. The first row shows results for the excitation temperature. The color bar shows values of excitation temperature, Tex for the grid of volume densities (x-axis), line widths (y-axis) and column densities (each panel) for fixed electron fraction. The second row shows results for opacity, τ, and the third row shows the peak temperature, Tpeak. The last row shows the χ2 minimization of the modeled peak temperature and the observed value computed from the CN(1−0) spectra.
Current usage metrics show cumulative count of Article Views (full-text article views including HTML views, PDF and ePub downloads, according to the available data) and Abstracts Views on Vision4Press platform.
Data correspond to usage on the plateform after 2015. The current usage metrics is available 48-96 hours after online publication and is updated daily on week days.
Initial download of the metrics may take a while.