Open Access
Fig. B.2
Download original image
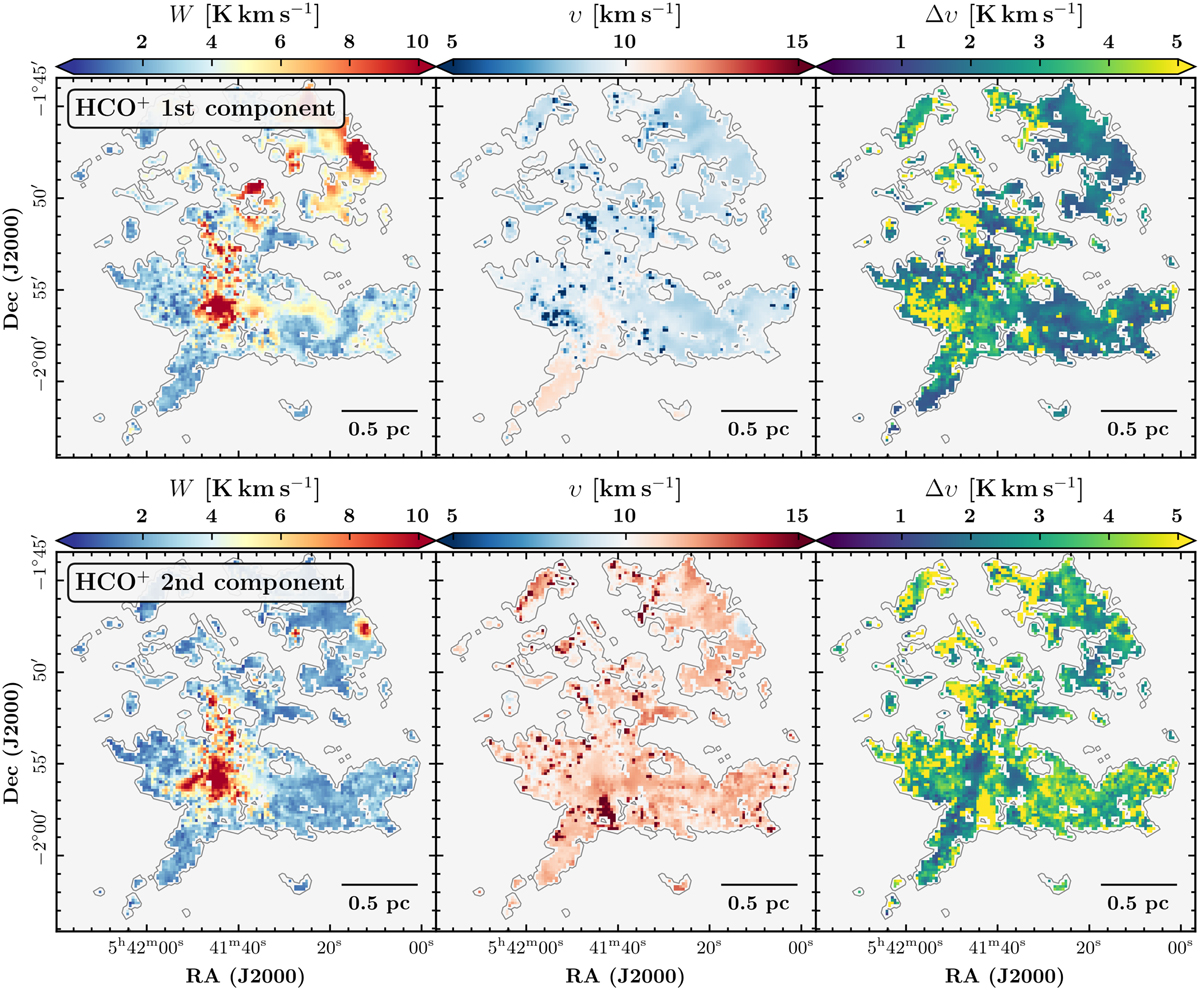
Fitting parameters for the HCO+ emission assuming a Gaussian line profile. Each row shows parameters for each fitted component. The results in the first row represent the brightest HCO+ component. The second row shows the fainter component and the outflow observed close to the center of NGC 2024.
Current usage metrics show cumulative count of Article Views (full-text article views including HTML views, PDF and ePub downloads, according to the available data) and Abstracts Views on Vision4Press platform.
Data correspond to usage on the plateform after 2015. The current usage metrics is available 48-96 hours after online publication and is updated daily on week days.
Initial download of the metrics may take a while.