Fig. A.6
Download original image
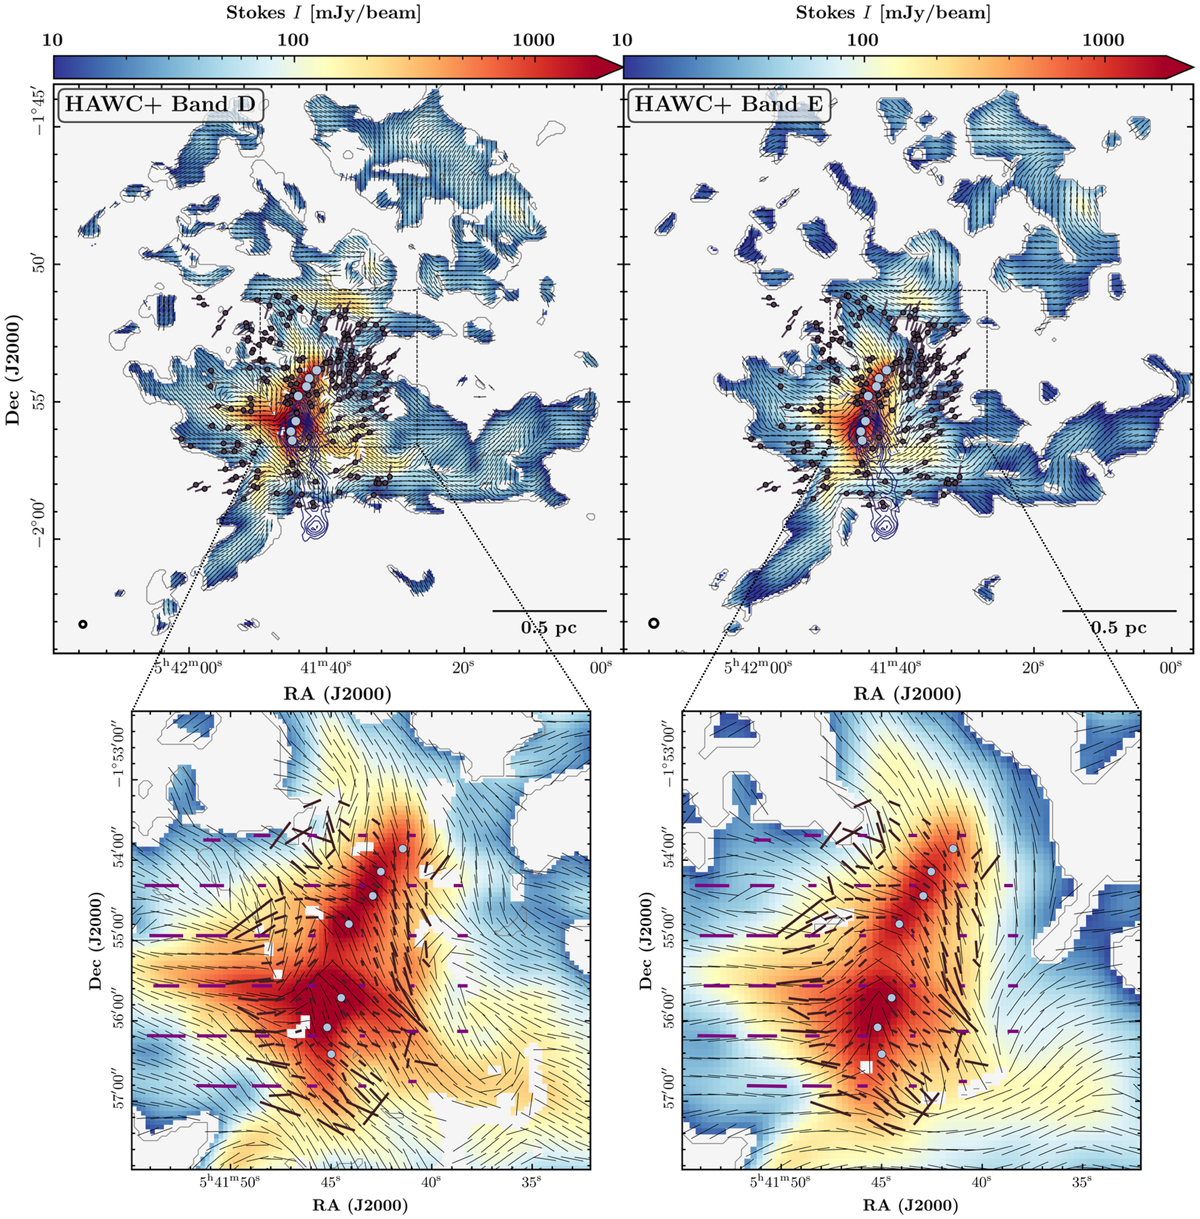
SOFIA HAWC+ dust continuum Band D and Band E measurements (left and right panels in the top row, respectively), but with overlayed positions of protostars and NIR polarization (dark purple circles and lines, Kandori et al. 2007). Dark blue contours represent the outflow observed in the HCO+ emission. Light blue points indicate the positions of FIR sources. Black dashed rectangles show the central area and the zoom-in panels on the bottom row. Here, we show magnetic field lines from the FIR dust polarization at 100 μm (Dotson et al. 2000) in dark magenta and from (sub)millimeter dust polarization at 850 μm (Matthews et al. 2002) in black.
Current usage metrics show cumulative count of Article Views (full-text article views including HTML views, PDF and ePub downloads, according to the available data) and Abstracts Views on Vision4Press platform.
Data correspond to usage on the plateform after 2015. The current usage metrics is available 48-96 hours after online publication and is updated daily on week days.
Initial download of the metrics may take a while.