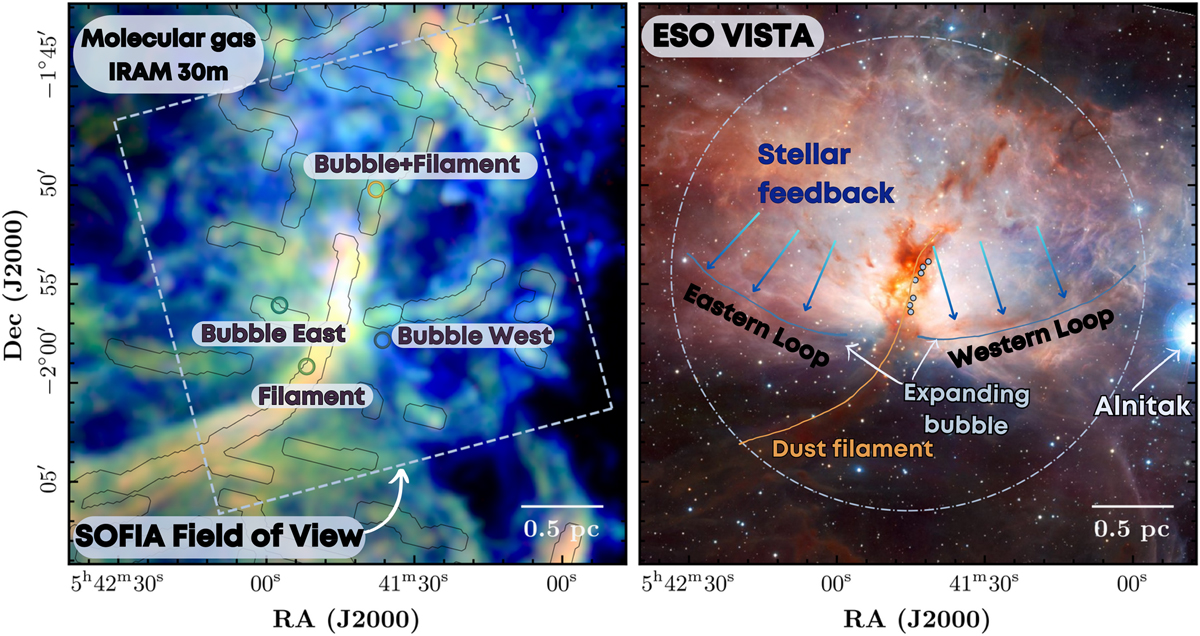
Fig. 1
Download original image
Multiwavelength image of NGC 2024. Left panel: Color-composite image of the Flame nebula (NGC 2024) showing peak intensities of 12CO (1−0) (blue) emission and isotopologues, 13CO (1−0) (green) and C18O (1−0) (red) obtained by the IRAM 30-meter telescope (image credits: Pety et al. 2017). We overlaid the SOFIA HAWC+ field of view as a white dashed rectangle. Gray contours show a network of filaments presented in Orkisz et al. (2019). We label the regions we investigate in this work: Bubble East, Bubble West, Filament, and Bubble+Filament. Right panel: ESO-VISTA image (ESO/J. Emerson/VISTA, Cambridge Astronomical Survey Unit). We sketched the environments seen across NGC 2024: the H II region (white dashed circle, see Table 2 in Gaudel et al. 2023) and the filament (orange line, Orkisz et al. 2019). Light blue points are the positions of far-infrared sources in the background (Mezger et al. 1988, 1992). In addition, we labeled the edges of the expanding H II region and the direction of the stellar feedback driven by the radiation produced by recent star formation.
Current usage metrics show cumulative count of Article Views (full-text article views including HTML views, PDF and ePub downloads, according to the available data) and Abstracts Views on Vision4Press platform.
Data correspond to usage on the plateform after 2015. The current usage metrics is available 48-96 hours after online publication and is updated daily on week days.
Initial download of the metrics may take a while.