Fig. 18.
Download original image
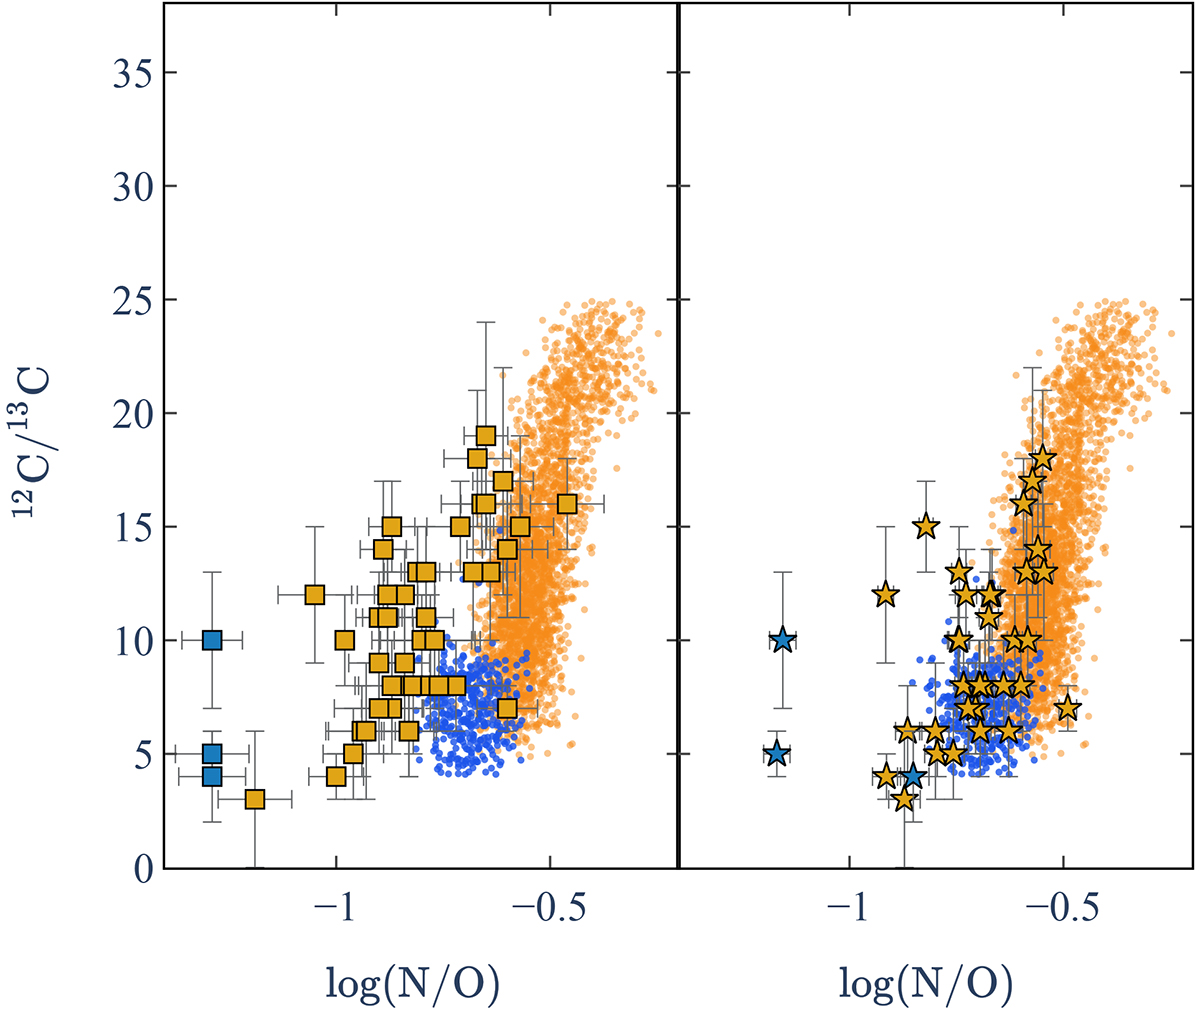
12C/13C vs. log(N/O) for core He-burning stars in our sample (left panel) and vs. log(N/O) derived by APOGEE DR17 (right panel) compared to the BGM simulations including the effects of thermohaline mixing. Thin and thick disc stars according to their Gaia kinematics are represented by the orange and blue symbols. The same colour-coding is used in the BGM simulation.
Current usage metrics show cumulative count of Article Views (full-text article views including HTML views, PDF and ePub downloads, according to the available data) and Abstracts Views on Vision4Press platform.
Data correspond to usage on the plateform after 2015. The current usage metrics is available 48-96 hours after online publication and is updated daily on week days.
Initial download of the metrics may take a while.