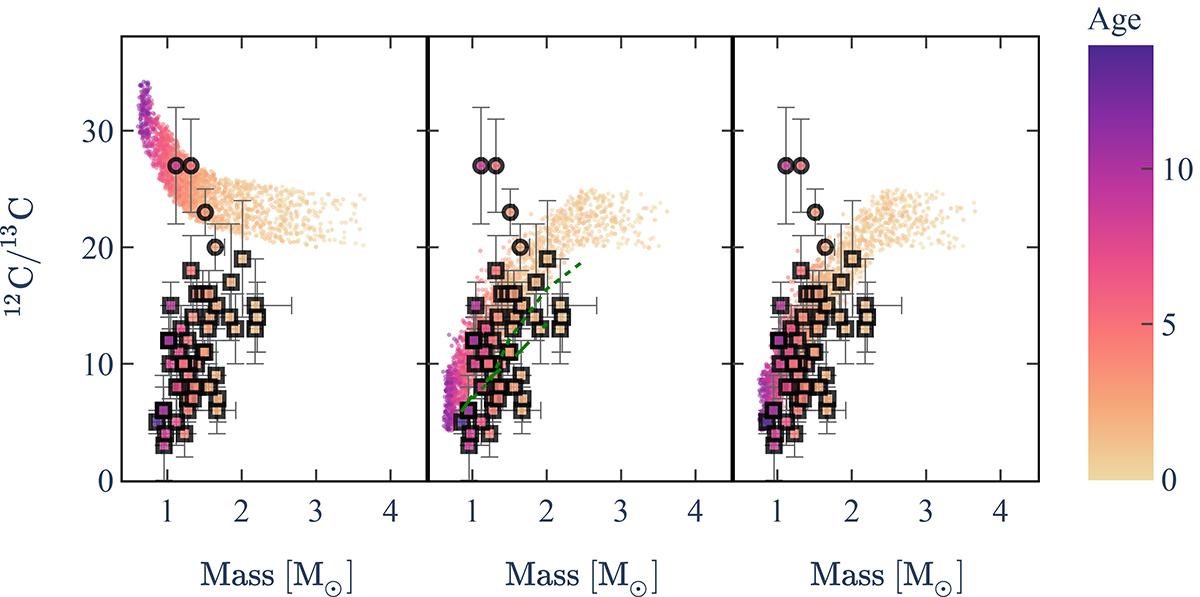
Fig. 14.
Download original image
Same as Fig. 13 for 12C/13C as a function of stellar mass. In the right panel, the mass loss rate is decreased on the RGB by a factor of two compared to the left and right panels (see text for details). The stellar age is colour-coded for both observations and BGM simulations. The green lines in the middle panel show the 12C/13C at the core He-burning phase predicted by stellar evolution models computed by Lagarde et al. (2012a) and including both thermohaline and rotation-induced mixing (at V/Vcrit ∼ 0.3) at [Fe/H] = 0 and [Fe/H] = −0.86 (dotted and dashed line, respectively).
Current usage metrics show cumulative count of Article Views (full-text article views including HTML views, PDF and ePub downloads, according to the available data) and Abstracts Views on Vision4Press platform.
Data correspond to usage on the plateform after 2015. The current usage metrics is available 48-96 hours after online publication and is updated daily on week days.
Initial download of the metrics may take a while.