Fig. 12.
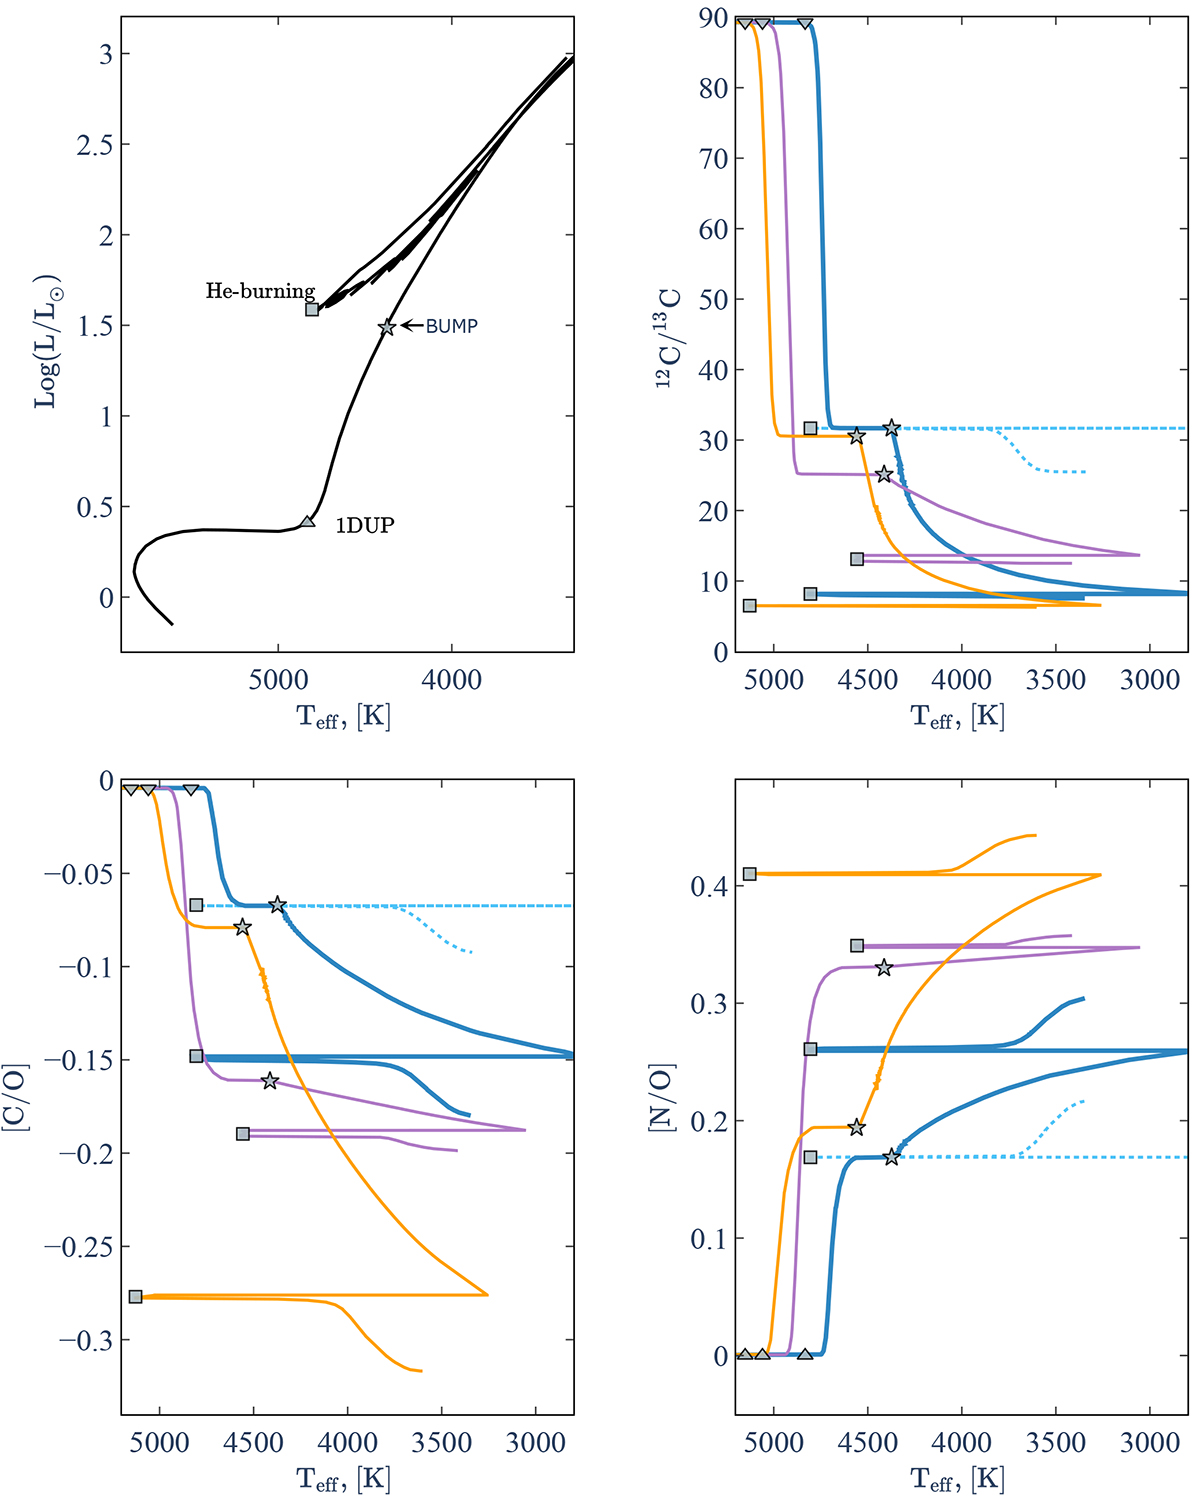
Download original image
Hertzsprung–Russell diagram of a 1.0 M⊙ model at solar metallicity (top left panel). Also shown are the evolution of 12C/13C (top right panel), [C/O] (bottom left panel), and [N/O] (bottom right panel) for the 1.0 M⊙ and 1.5 M⊙ model at solar metallicity (blue and purple lines, respectively) and for 1.0 M⊙ at [Fe/H] = –0.54 (orange line) from the subgiant branch to the RGB tip and later from the core He-burning to AGB phase. The tracks show the predicted behaviour from stellar evolution models taking into account or not the effects of thermohaline mixing (solid and dashed lines, respectively). The position of the beginning of the first dredge-up, the RGB bump, and the core He-burning phase are indicated in each panel (triangle, star, and square, respectively).
Current usage metrics show cumulative count of Article Views (full-text article views including HTML views, PDF and ePub downloads, according to the available data) and Abstracts Views on Vision4Press platform.
Data correspond to usage on the plateform after 2015. The current usage metrics is available 48-96 hours after online publication and is updated daily on week days.
Initial download of the metrics may take a while.