Fig. 3.
Download original image
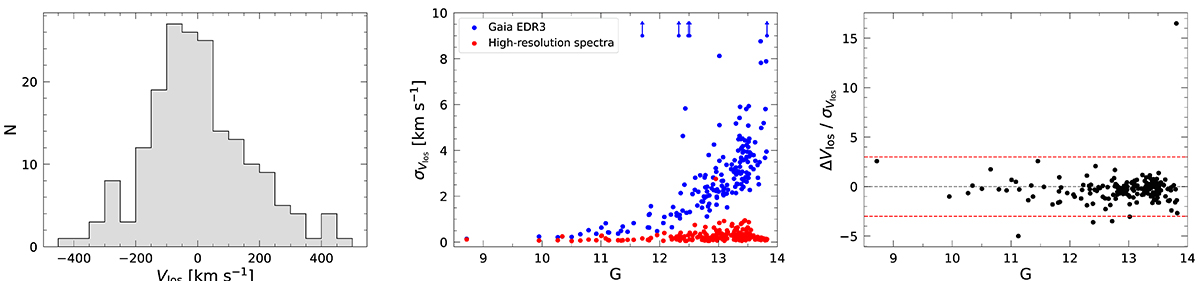
Line-of-sight velocity distribution for the entire stellar sample, shown on the left. Central panel shows comparison between the uncertainty on the line-of-sight velocity provided by Gaia (blue filled circles) and the one measured with high-resolution spectroscopy (red filled circles) as a function of observed G magnitude. The blue arrows point out the outliers in the distribution, specifically representing target stars with errors in the Gaia velocity measurement larger than 10 km s−1. Right panel shows the difference between the two measurements of the line-of-sight velocity. The red dashed lines mark the ±3σ threshold.
Current usage metrics show cumulative count of Article Views (full-text article views including HTML views, PDF and ePub downloads, according to the available data) and Abstracts Views on Vision4Press platform.
Data correspond to usage on the plateform after 2015. The current usage metrics is available 48-96 hours after online publication and is updated daily on week days.
Initial download of the metrics may take a while.