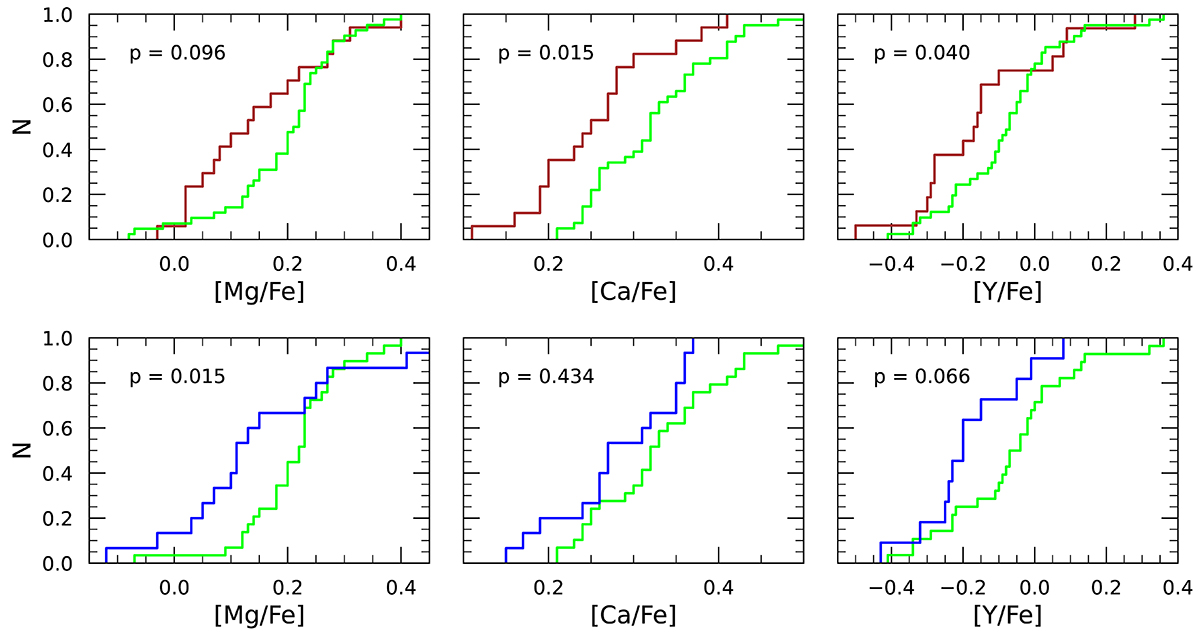
Fig. 16.
Download original image
Comparison of the cumulative distribution functions of [Mg/Fe], [Ca/Fe] and [Y/Fe] for Sequoia and GES stars (brown and green lines, respectively) in the common metallicity range (−2.60 < [Fe/H] < −1.20 dex) shown at the top. We report the probability that the two distributions are drawn from the same parent sample according to a Kolmogorov-Smirnov test. Bottom panel is the same as the top, but for Antaeus and GES stars (blue and green lines, respectively) in the common metallicity range (−2.60 < [Fe/H] < −1.45 dex).
Current usage metrics show cumulative count of Article Views (full-text article views including HTML views, PDF and ePub downloads, according to the available data) and Abstracts Views on Vision4Press platform.
Data correspond to usage on the plateform after 2015. The current usage metrics is available 48-96 hours after online publication and is updated daily on week days.
Initial download of the metrics may take a while.