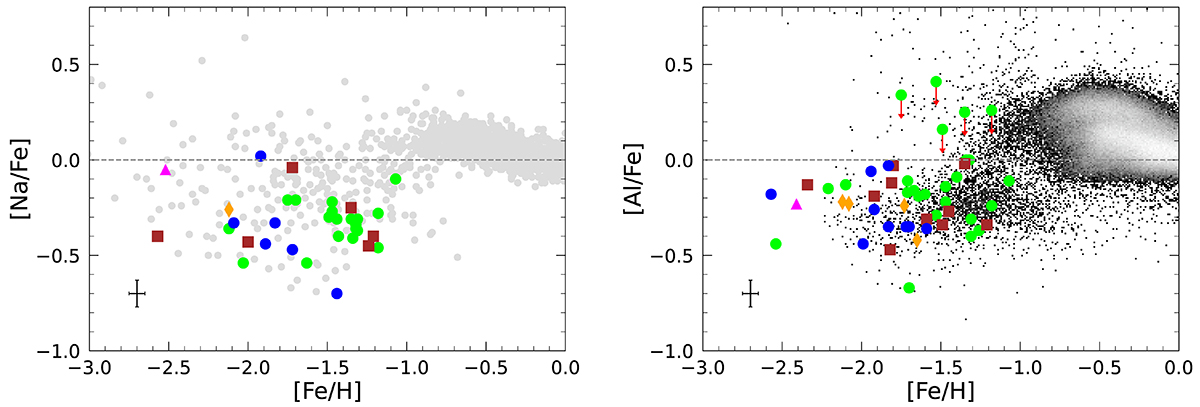
Fig. 12.
Download original image
Behavior of the odd-Z elements [Na/Fe] and [Al/Fe] abundance ratios as a function of [Fe/H] for GES, Sequoia, Antaeus, ED-2, and ED-3 stars (green, brown, blue, magenta, and orange, respectively). Red arrows indicate the upper limits. The errorbars in the lower-left corner indicate the typical uncertainties. The MW literature data for Na abundances are taken from Edvardsson et al. (1993), Fulbright (2000), Stephens & Boesgaard (2002), Gratton et al. (2003), Reddy et al. (2003, 006), Bensby et al. (2005, 2014), Roederer et al. (2014) and Reggiani et al. (2017). The APOGEE control sample, as defined in Sect. 6, is plotted as a 2D histogram, where black and white colors stand for low and high density regions, respectively.
Current usage metrics show cumulative count of Article Views (full-text article views including HTML views, PDF and ePub downloads, according to the available data) and Abstracts Views on Vision4Press platform.
Data correspond to usage on the plateform after 2015. The current usage metrics is available 48-96 hours after online publication and is updated daily on week days.
Initial download of the metrics may take a while.