Fig. 9
Download original image
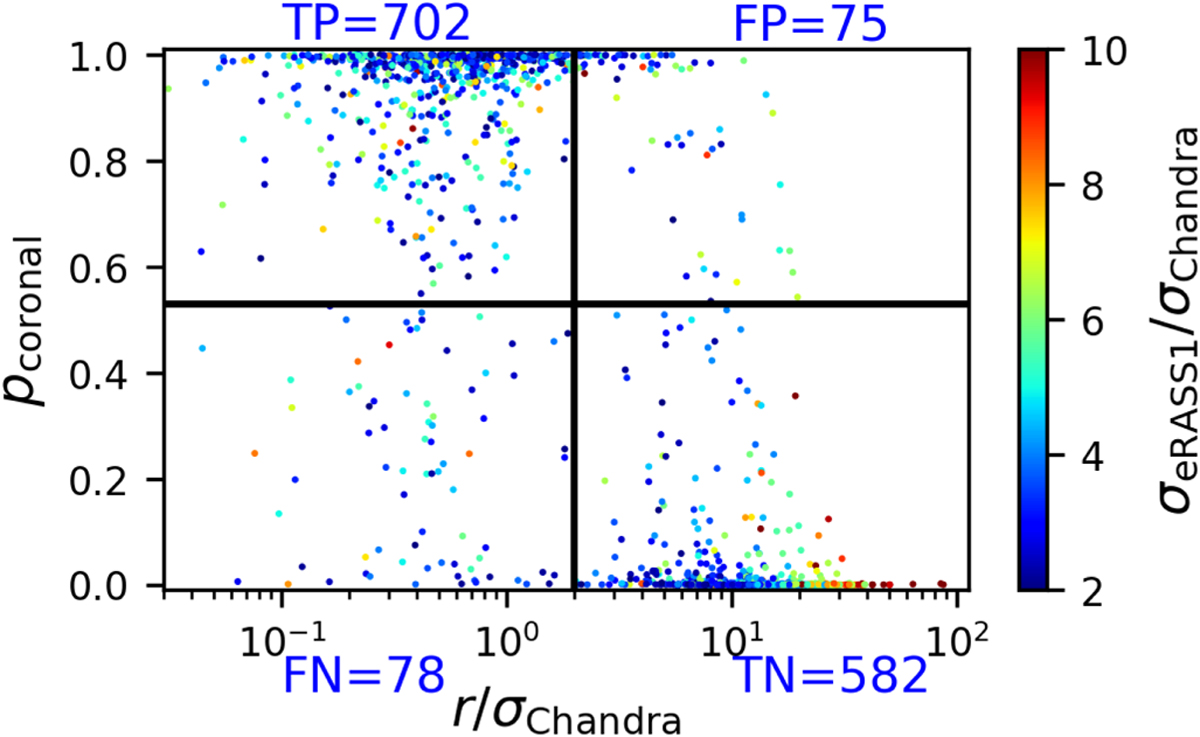
Coronal probability of the eRASSl sources as a function of the separation between the best coronal counterpart and the Chandra detection given in units of positional uncertainty. The solid lines show the thresholds at Pcoronai = 0.53 and r/σChandra = 2. The color scales with the ratio of the positional uncertainties from eRASSl and Chandra. The numbers of sources in the resulting four quadrants are specified above and below the figure.
Current usage metrics show cumulative count of Article Views (full-text article views including HTML views, PDF and ePub downloads, according to the available data) and Abstracts Views on Vision4Press platform.
Data correspond to usage on the plateform after 2015. The current usage metrics is available 48-96 hours after online publication and is updated daily on week days.
Initial download of the metrics may take a while.