Fig. 6
Download original image
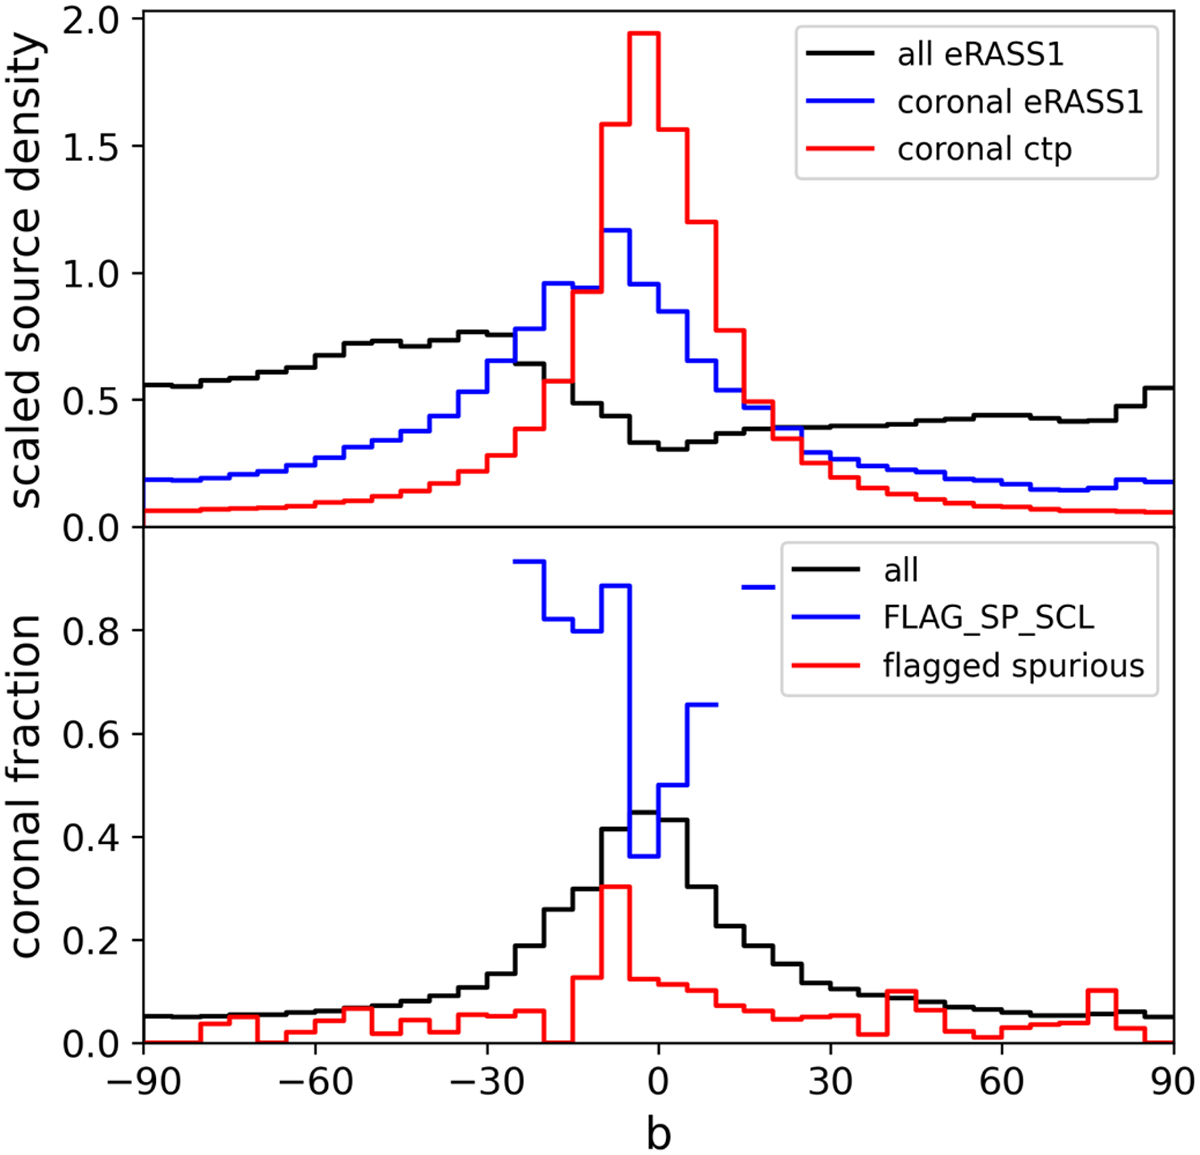
Distribution of the source density and the coronal fraction as a function of Galactic latitude. The scaled source density of all eRASS1 sources, the coronal eRASS1 sources, and the eligible coronal counterparts are shown in the top panel by the black, blue, and red lines, respectively. The source densities are scaled by the area covered by the bins and the total number of objects in the different samples. The bottom panel shows the distribution of the coronal fraction. The fraction of stars for all eRASS1 sources estimated with the Bayes map is indicated by the solid black line. The red and blue lines show the coronal fraction for the sources flagged in the eRASS1 catalog as likely spurious detections and as sources in stellar clusters, respectively.
Current usage metrics show cumulative count of Article Views (full-text article views including HTML views, PDF and ePub downloads, according to the available data) and Abstracts Views on Vision4Press platform.
Data correspond to usage on the plateform after 2015. The current usage metrics is available 48-96 hours after online publication and is updated daily on week days.
Initial download of the metrics may take a while.