Open Access
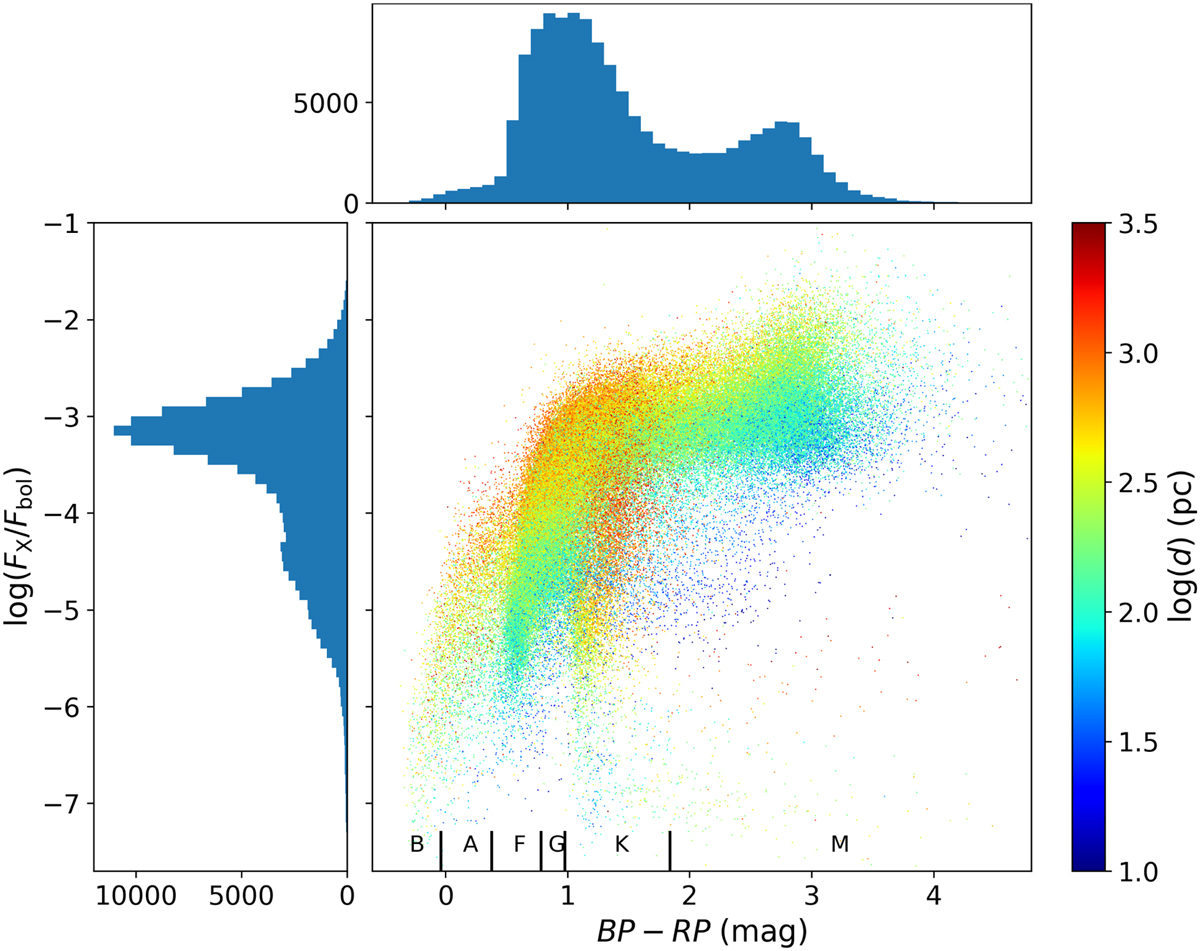
Fig. 16
Download original image
X-ray to bolometric flux ratio as a function of BP–RP color for the coronal eRASS1 sources. The color scales with the distance of the counterpart and the histograms in the upper and left panels show the distribution of the BP–RP color and that of the fractional X-ray flux, respectively.
Current usage metrics show cumulative count of Article Views (full-text article views including HTML views, PDF and ePub downloads, according to the available data) and Abstracts Views on Vision4Press platform.
Data correspond to usage on the plateform after 2015. The current usage metrics is available 48-96 hours after online publication and is updated daily on week days.
Initial download of the metrics may take a while.