Fig. 11
Download original image
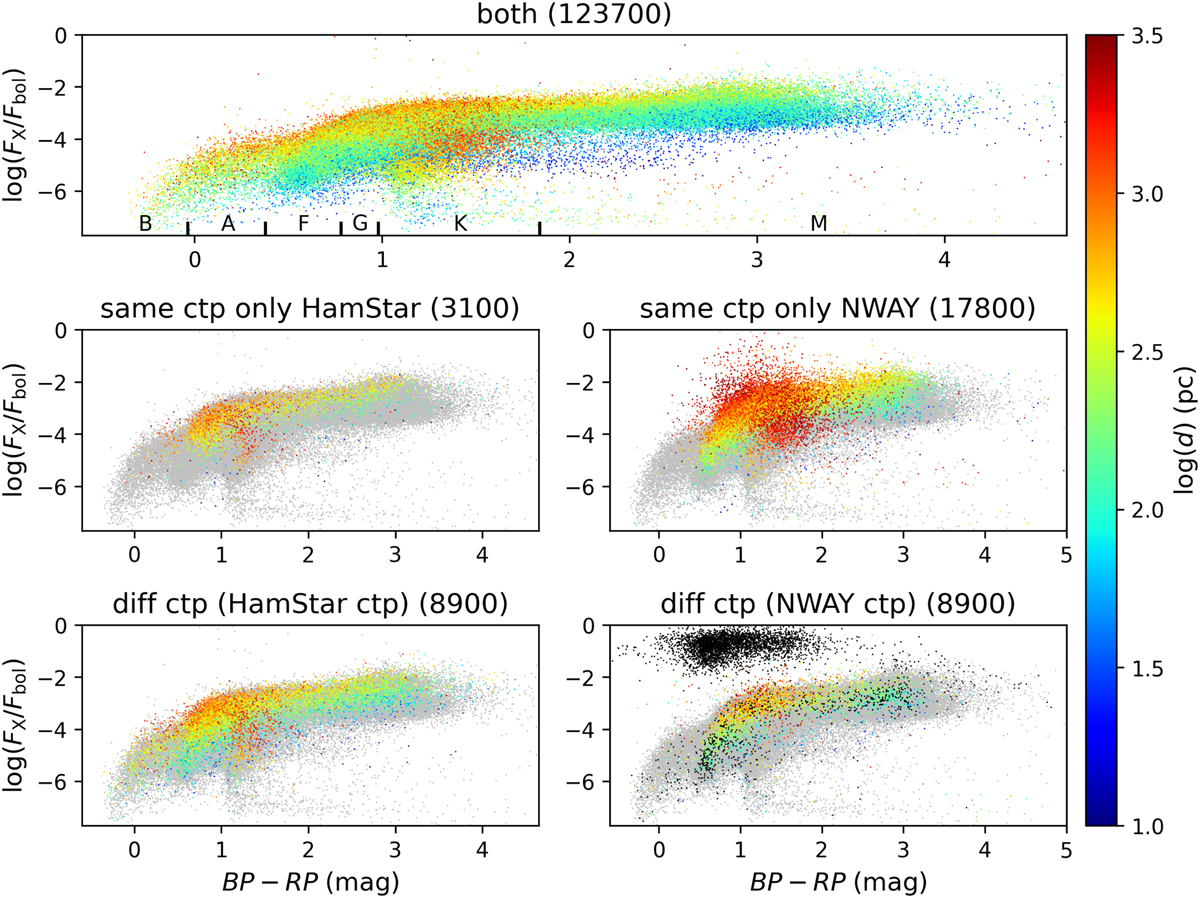
Comparison of the X-ray to bolometric flux ratio as a function of the BP–RP color for the eRASS1 sources with the same and different counterparts by NWAY and our method. The top panel shows the distribution of the consistently identified sources, and the middle panel shows the sources only identified by our method (left) and NWAY (right). In the bottom panels, the sources with different counterparts are compared, while the best counterparts from our method and NWAY are shown in the left and right panels, respectively. The numbers of sources in the panels are specified in parentheses (cf. Table 1). The color scales with the distance of the counterparts and ineligible coronal counterparts from NWAY are shown as black dots.
Current usage metrics show cumulative count of Article Views (full-text article views including HTML views, PDF and ePub downloads, according to the available data) and Abstracts Views on Vision4Press platform.
Data correspond to usage on the plateform after 2015. The current usage metrics is available 48-96 hours after online publication and is updated daily on week days.
Initial download of the metrics may take a while.