Fig. 10
Download original image
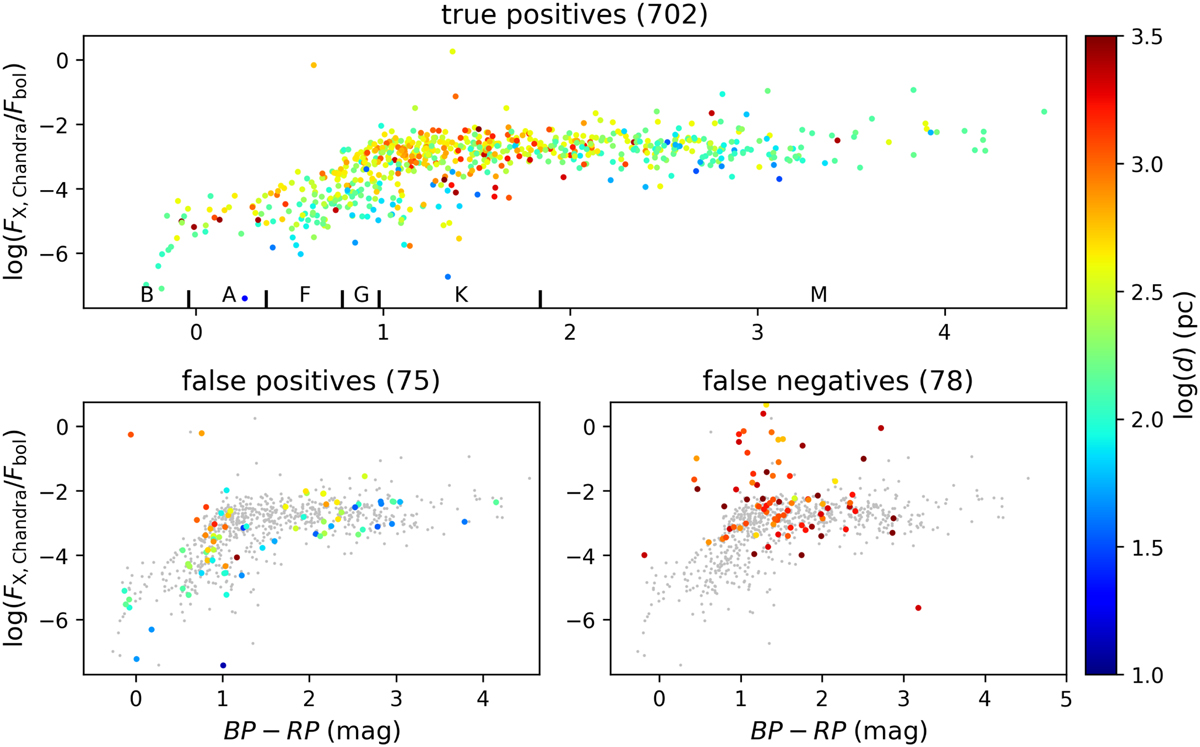
Comparison of the X-ray to bolometric flux ratio as a function of BP–RP color for the eRASS1 sources with a Chandra association. The color scales with the distance of the counterparts. The top, left, and right panels show the distribution for the true positives, false positives, and false negatives, respectively. The gray dots show the distribution of the top panel for comparison.
Current usage metrics show cumulative count of Article Views (full-text article views including HTML views, PDF and ePub downloads, according to the available data) and Abstracts Views on Vision4Press platform.
Data correspond to usage on the plateform after 2015. The current usage metrics is available 48-96 hours after online publication and is updated daily on week days.
Initial download of the metrics may take a while.