Fig. 8.
Download original image
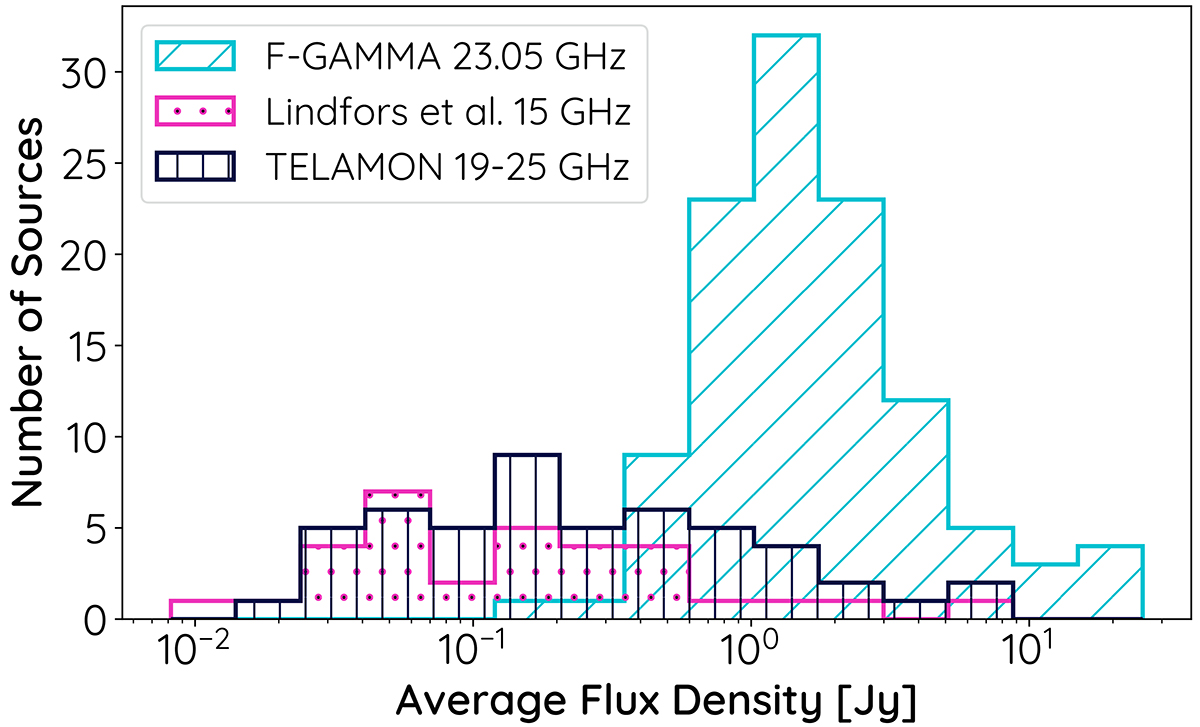
Comparison of the GeV-selected F-GAMMA (Angelakis et al. 2019, blue with diagonal stripes) and the TeV-selected Lindfors et al. (2016) and TELAMON samples (magenta with dots and black with vertical stripes, respectively) according to the average source radio flux density (F-GAMMA: 23.05 GHz, Lindfors et al.: 15 GHz, TELAMON: 14 mm, i.e., 19–25 GHz).
Current usage metrics show cumulative count of Article Views (full-text article views including HTML views, PDF and ePub downloads, according to the available data) and Abstracts Views on Vision4Press platform.
Data correspond to usage on the plateform after 2015. The current usage metrics is available 48-96 hours after online publication and is updated daily on week days.
Initial download of the metrics may take a while.