Open Access
Fig. 7.
Download original image
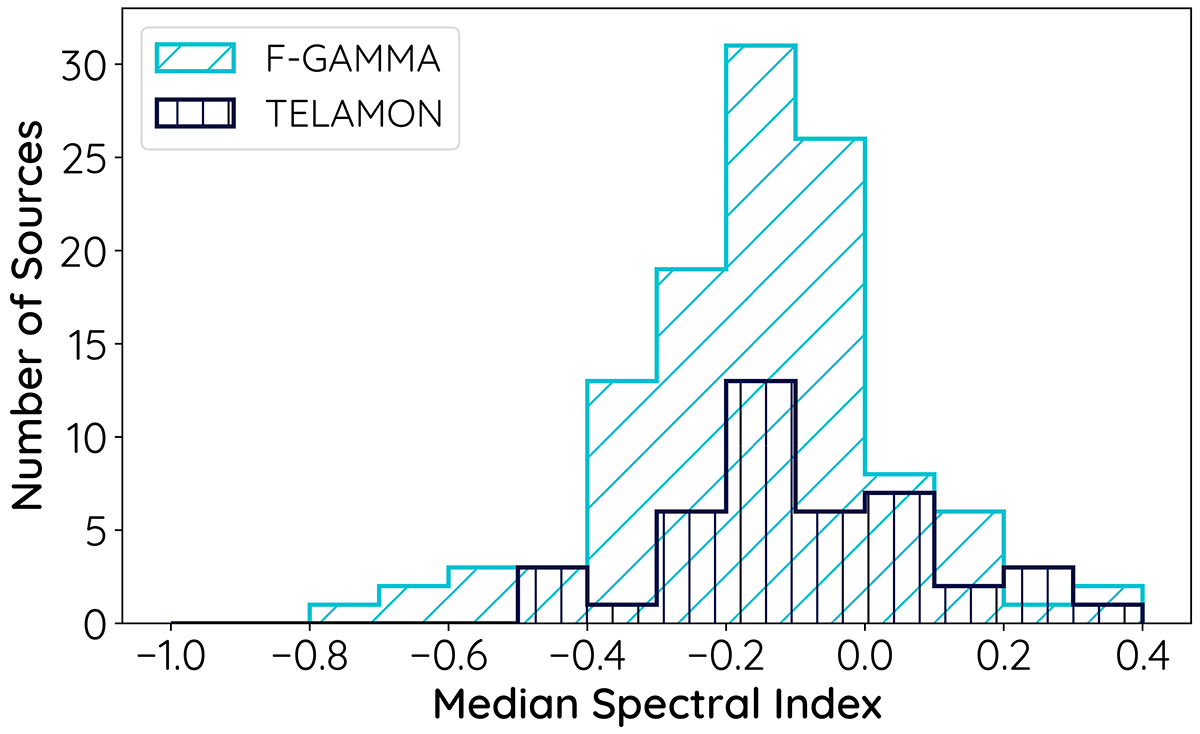
Histogram plot of median radio spectral indices for all sources from the F-GAMMA sample (Angelakis et al. 2019, blue with diagonal stripes) and the TELAMON (black with vertical stripes) sample between 14 GHz and 45 GHz.
Current usage metrics show cumulative count of Article Views (full-text article views including HTML views, PDF and ePub downloads, according to the available data) and Abstracts Views on Vision4Press platform.
Data correspond to usage on the plateform after 2015. The current usage metrics is available 48-96 hours after online publication and is updated daily on week days.
Initial download of the metrics may take a while.