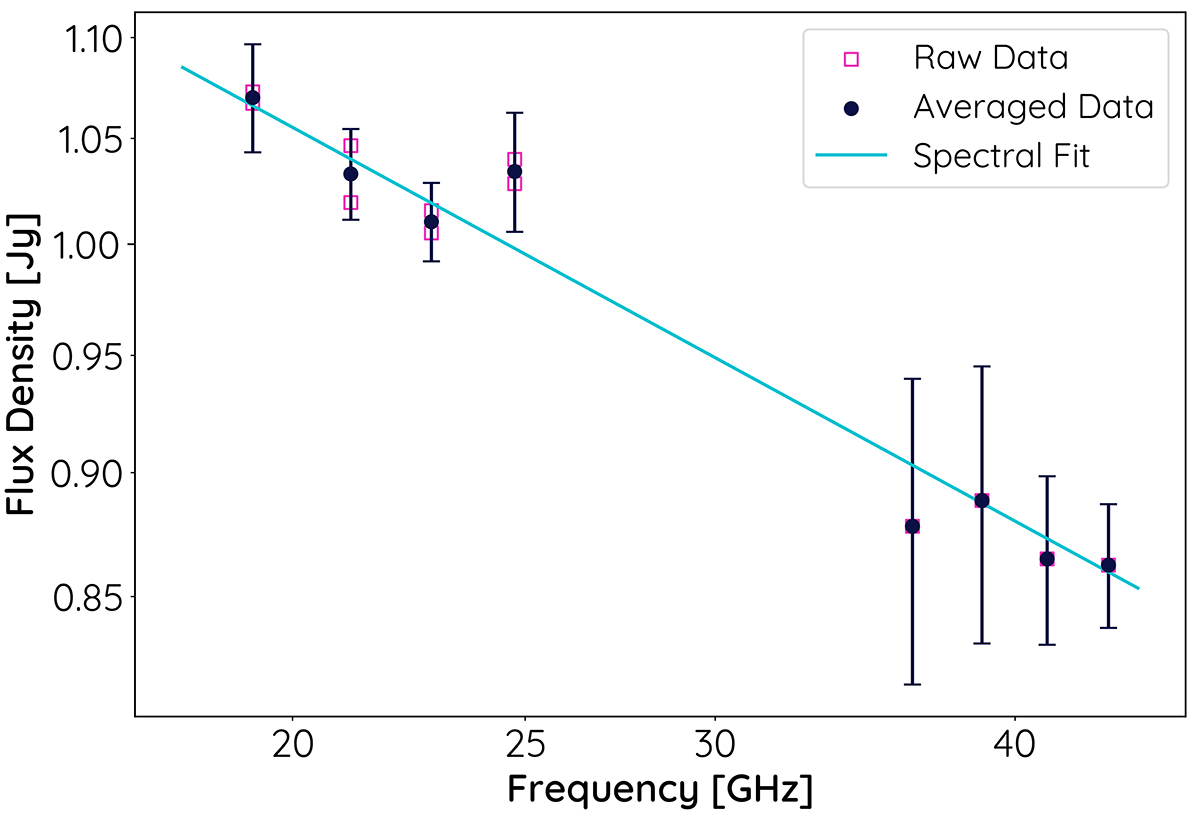
Fig. 3.
Download original image
Example of the power-law spectral fitting process (J1653+3945, also known as Mrk 501, on July 28, 2021). The magenta squares indicate the raw data, uncertainties are not shown to enhance readability. For every frequency, where more than one raw flux density value was available, the flux densities were averaged (black dots). The averaged flux densities were then fitted with a power-law spectrum (blue line). In the presented case, we found α = −0.262 ± 0.021.
Current usage metrics show cumulative count of Article Views (full-text article views including HTML views, PDF and ePub downloads, according to the available data) and Abstracts Views on Vision4Press platform.
Data correspond to usage on the plateform after 2015. The current usage metrics is available 48-96 hours after online publication and is updated daily on week days.
Initial download of the metrics may take a while.