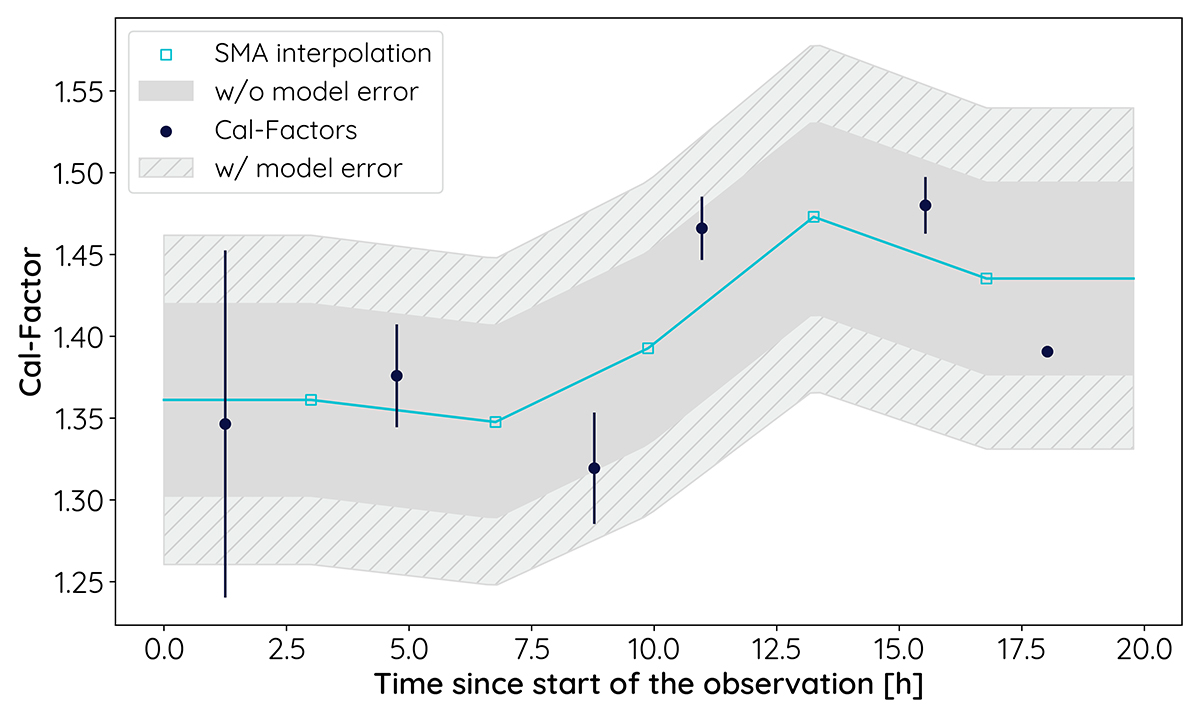
Fig. 1.
Download original image
Example of the calibration factor evolution at 38.75 GHz during the observing session on Oct. 24, 2021. The black dots correspond to the (sub-)averaged calibration factor measurements Γc, i. The blue line and blue squares indicate the simple moving average (SMA) interpolated calibration factor ΓSMA, i (see Eq. (1)), as used in the final analysis. The dark gray area represents the calibrator scatter σsc, ν, while the light gray hashed area represents the total calibration uncertainty σcal, including the model uncertainty σmodel and σsc, ν.
Current usage metrics show cumulative count of Article Views (full-text article views including HTML views, PDF and ePub downloads, according to the available data) and Abstracts Views on Vision4Press platform.
Data correspond to usage on the plateform after 2015. The current usage metrics is available 48-96 hours after online publication and is updated daily on week days.
Initial download of the metrics may take a while.