Fig. A.1
Download original image
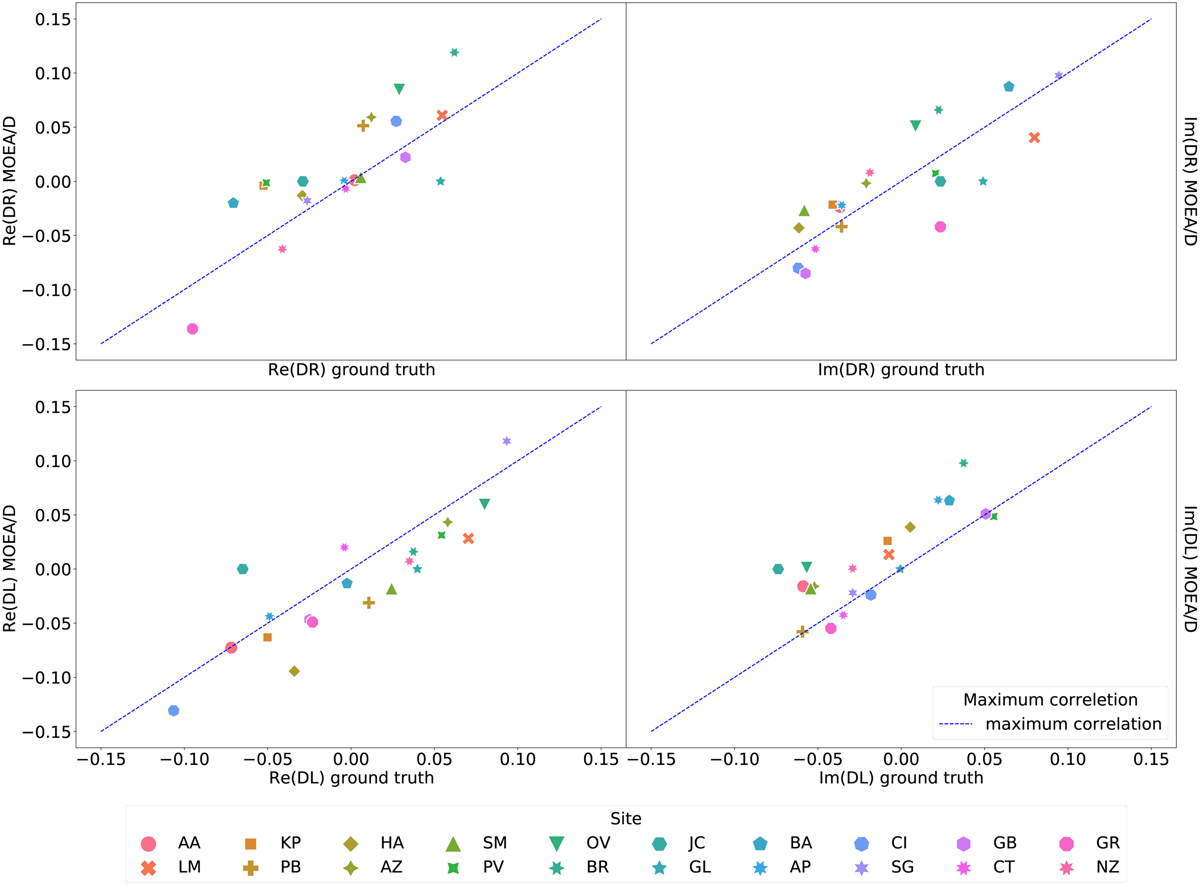
D-terms comparison between the ground truth simulated and that recovered by MOEA/D using closure-only of the source showed in Fig. A.2. Different sites are represented by different colors and markers explained in the legend. The dashed blue lines indicates a perfect correlation. The closer the derms to the line the better correlation between the terms. Top row: DR dterms (real and imaginary part from left to right). Bottom row: DL dterms.
Current usage metrics show cumulative count of Article Views (full-text article views including HTML views, PDF and ePub downloads, according to the available data) and Abstracts Views on Vision4Press platform.
Data correspond to usage on the plateform after 2015. The current usage metrics is available 48-96 hours after online publication and is updated daily on week days.
Initial download of the metrics may take a while.