Fig. A.9
Download original image
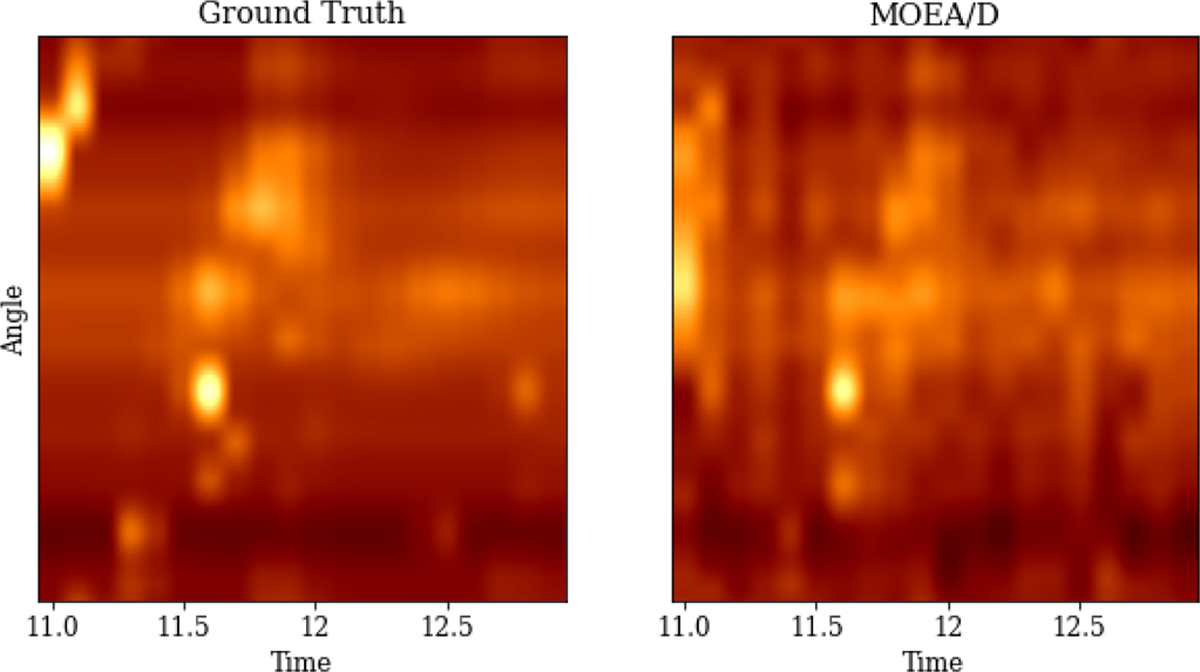
Phase diagrams as presented in Mus & Martí-Vidal (2024). Horizontal axis represent the time (frames) and vertical axis the angle. Keyframes are linearly interpolated in every integration time. Left panel: Model corresponding to the dynamical movie. Right panel: Recovered movie. We can see how MMOEA/D is able to recover the hotpsot movement (brightest lines).
Current usage metrics show cumulative count of Article Views (full-text article views including HTML views, PDF and ePub downloads, according to the available data) and Abstracts Views on Vision4Press platform.
Data correspond to usage on the plateform after 2015. The current usage metrics is available 48-96 hours after online publication and is updated daily on week days.
Initial download of the metrics may take a while.