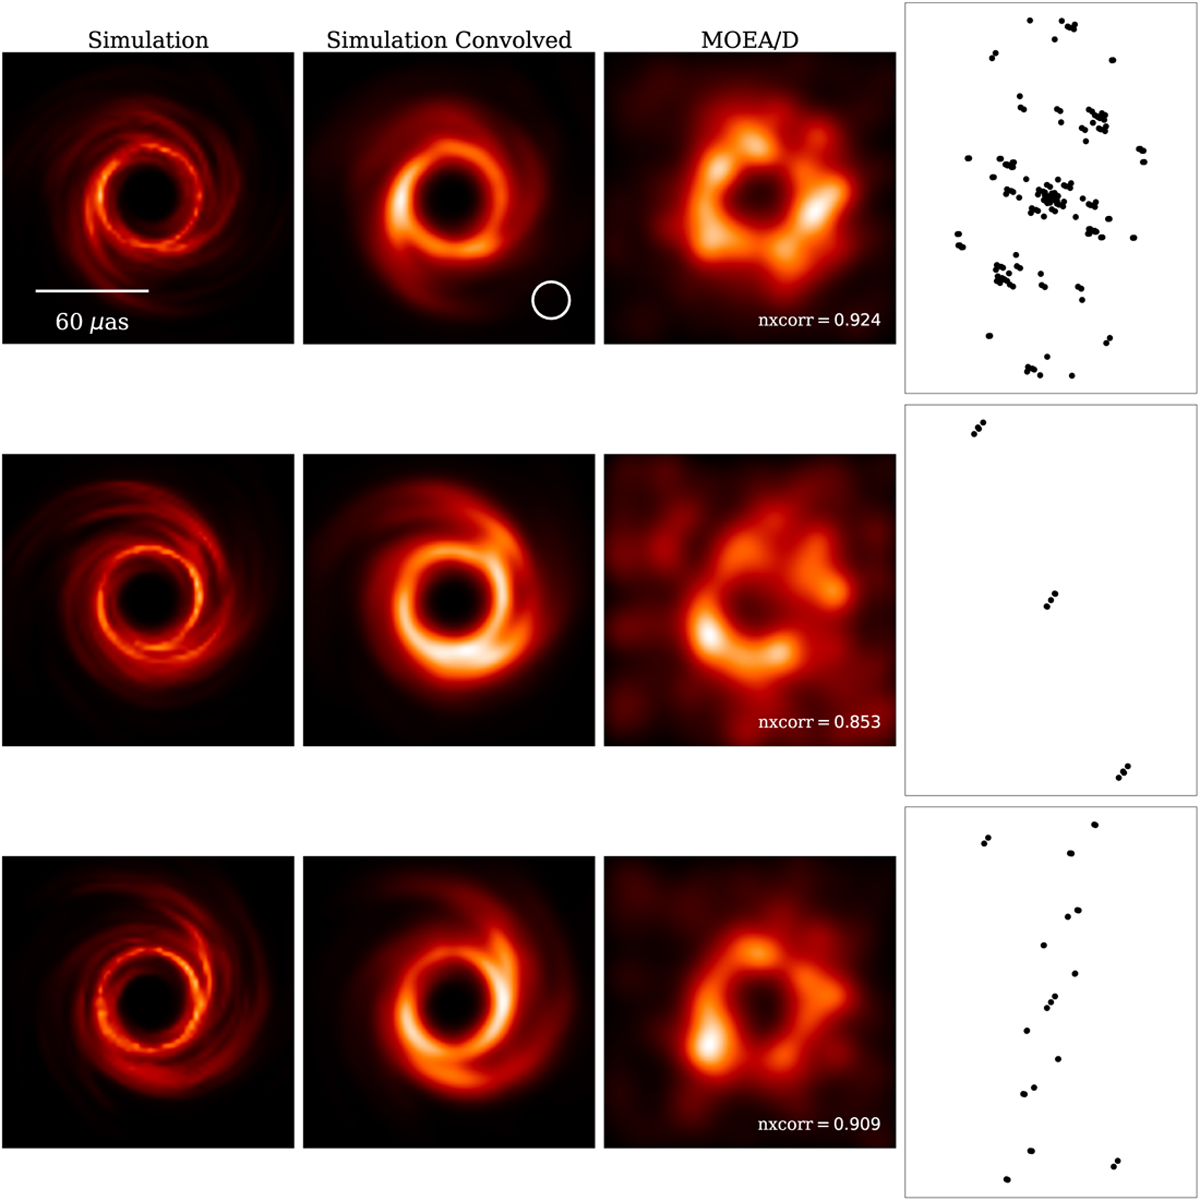
Fig. A.8

Download original image
Comparison reconstructions of Johnson et al. (2017) method and MOEA/D for the different uυ-coverages of each keyframe. The color scale is linear and is consistent among different times, but is scaled separately for each case, based on the maximum brightness over all frames. The normal cross-corrleation (nxcorr) value between the recovered and the convolved model can be found in the bottom corner of the reconstructed images. A frame-wise comparison can be found in Mus (2023).
Current usage metrics show cumulative count of Article Views (full-text article views including HTML views, PDF and ePub downloads, according to the available data) and Abstracts Views on Vision4Press platform.
Data correspond to usage on the plateform after 2015. The current usage metrics is available 48-96 hours after online publication and is updated daily on week days.
Initial download of the metrics may take a while.


