Fig. 9
Download original image
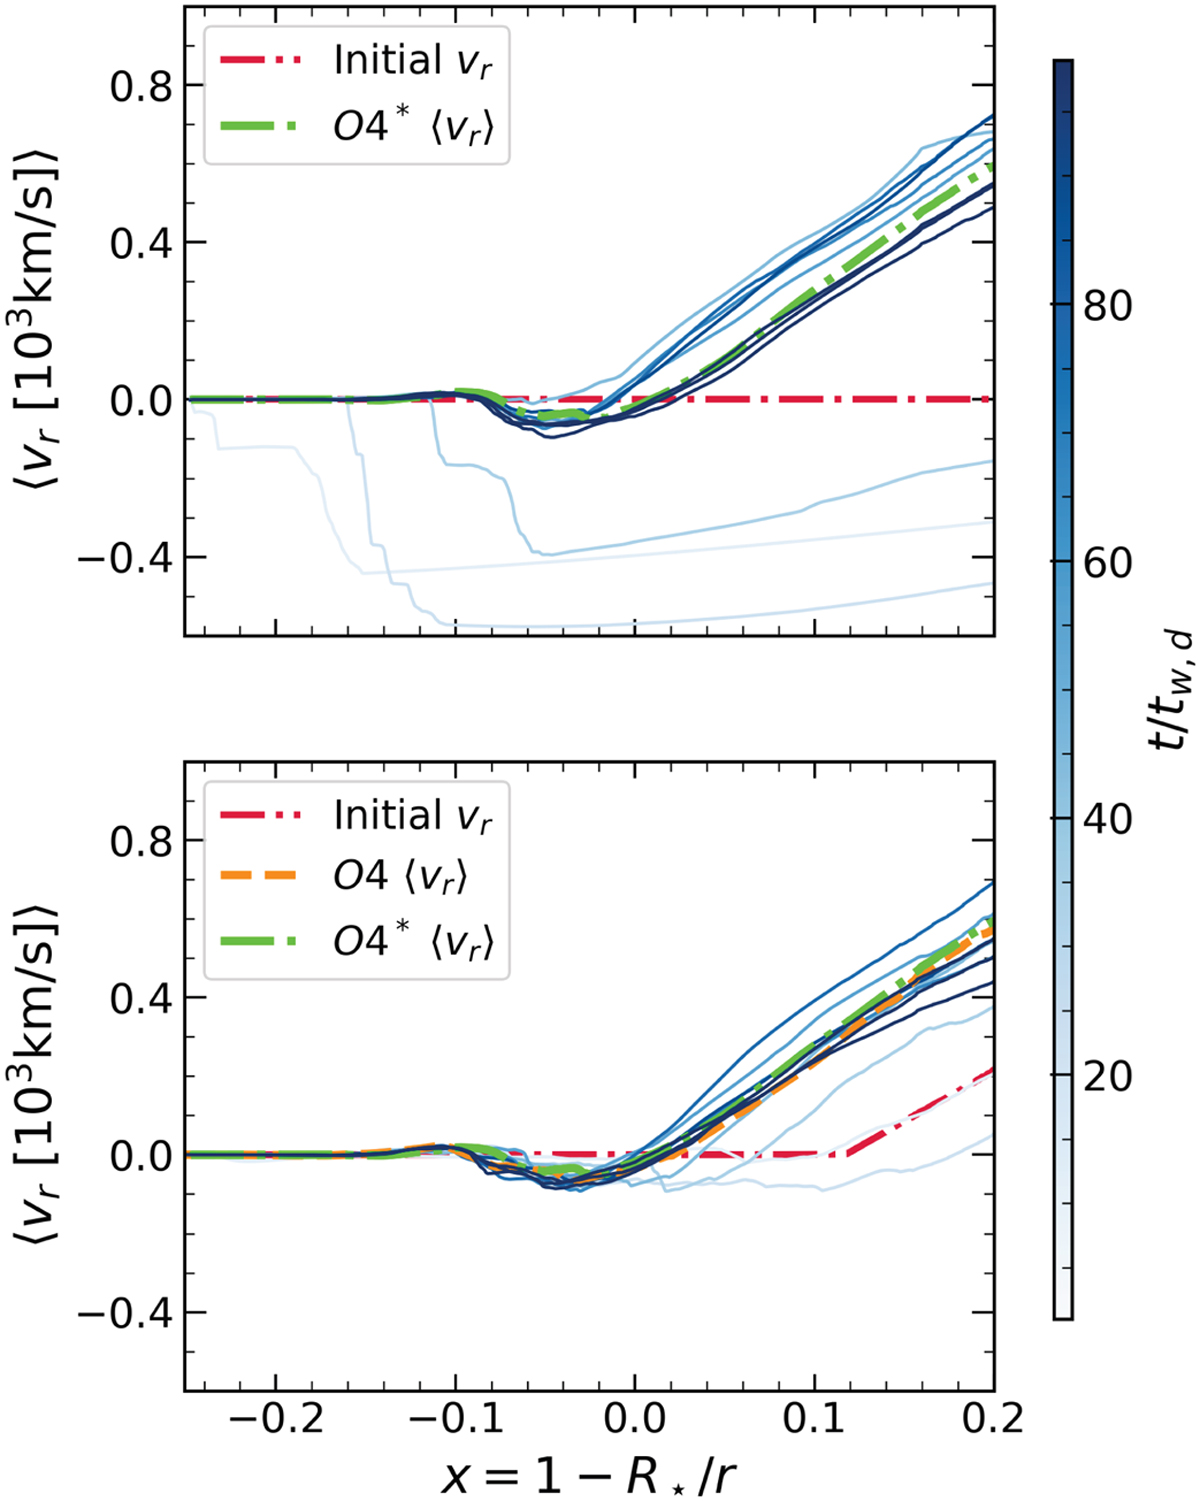
Running averages of the radial velocities for the O4* model (top) and O4 model (bottom), taken over 10 snapshots starting from the beginning of the simulation, with lighter colours representing earlier times. The red dash-dotted lines are the initial velocity profiles. The green dash-dotted line is the final average for the O4* model and the orange dashed line is for the O4 model. See text.
Current usage metrics show cumulative count of Article Views (full-text article views including HTML views, PDF and ePub downloads, according to the available data) and Abstracts Views on Vision4Press platform.
Data correspond to usage on the plateform after 2015. The current usage metrics is available 48-96 hours after online publication and is updated daily on week days.
Initial download of the metrics may take a while.