Fig. 6
Download original image
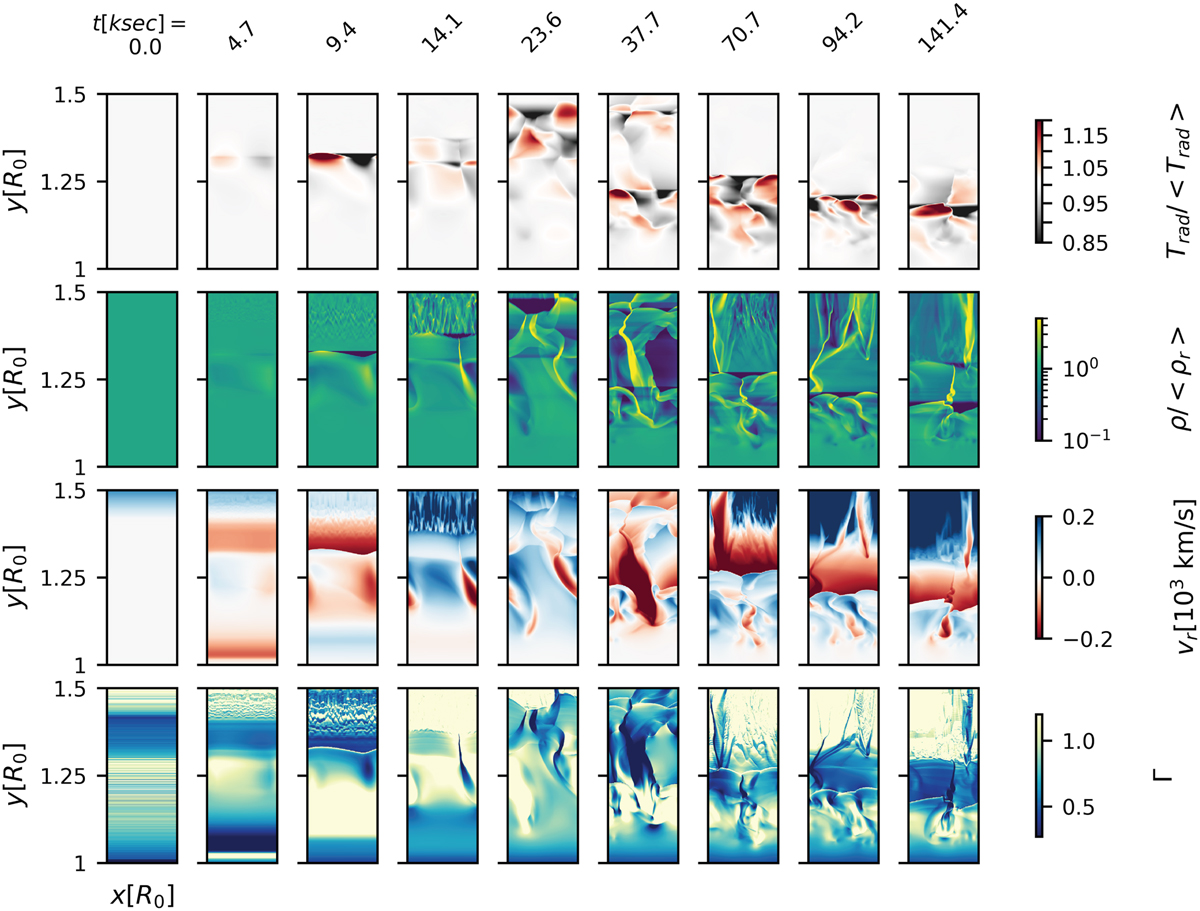
Colour maps of relative radiation temperature (top panel), relative density (second panel), and the radial velocity (third panel) and Γ (bottom panel), for several snapshots at different times (shown on top in 103 seconds) at the beginning of our simulation for the O4 model. The figures are zoomed in to show the inner regions of our simulations. In the lateral direction, the figure extends to 0.2 R0 and in the radial direction to 1.5 R0, with R0 as the lower boundary radius of our simulation.
Current usage metrics show cumulative count of Article Views (full-text article views including HTML views, PDF and ePub downloads, according to the available data) and Abstracts Views on Vision4Press platform.
Data correspond to usage on the plateform after 2015. The current usage metrics is available 48-96 hours after online publication and is updated daily on week days.
Initial download of the metrics may take a while.