Fig. 2
Download original image
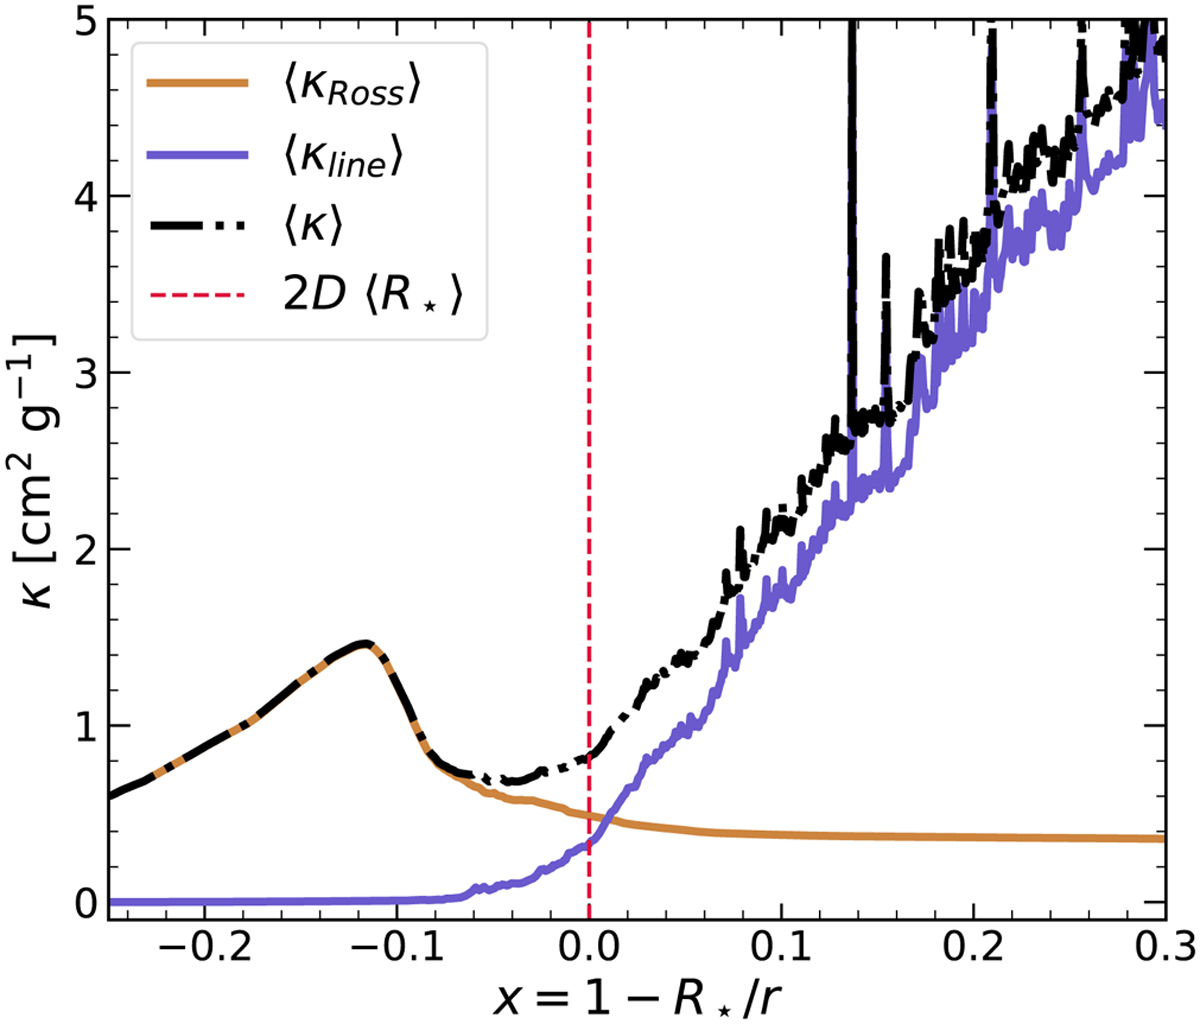
Averaged opacity 〈κ〉 as a function of scaled radius x = 1 − R★/r, with R★ as the 2D averaged optical photosphere (red-dashed line). In the figure, the brown curve is the Rosseland mean opacity and the purple curve is the finite-disk corrected line-opacity. The black dash-dotted curve is the total opacity using the hybrid opacity scheme.
Current usage metrics show cumulative count of Article Views (full-text article views including HTML views, PDF and ePub downloads, according to the available data) and Abstracts Views on Vision4Press platform.
Data correspond to usage on the plateform after 2015. The current usage metrics is available 48-96 hours after online publication and is updated daily on week days.
Initial download of the metrics may take a while.