Fig. 18
Download original image
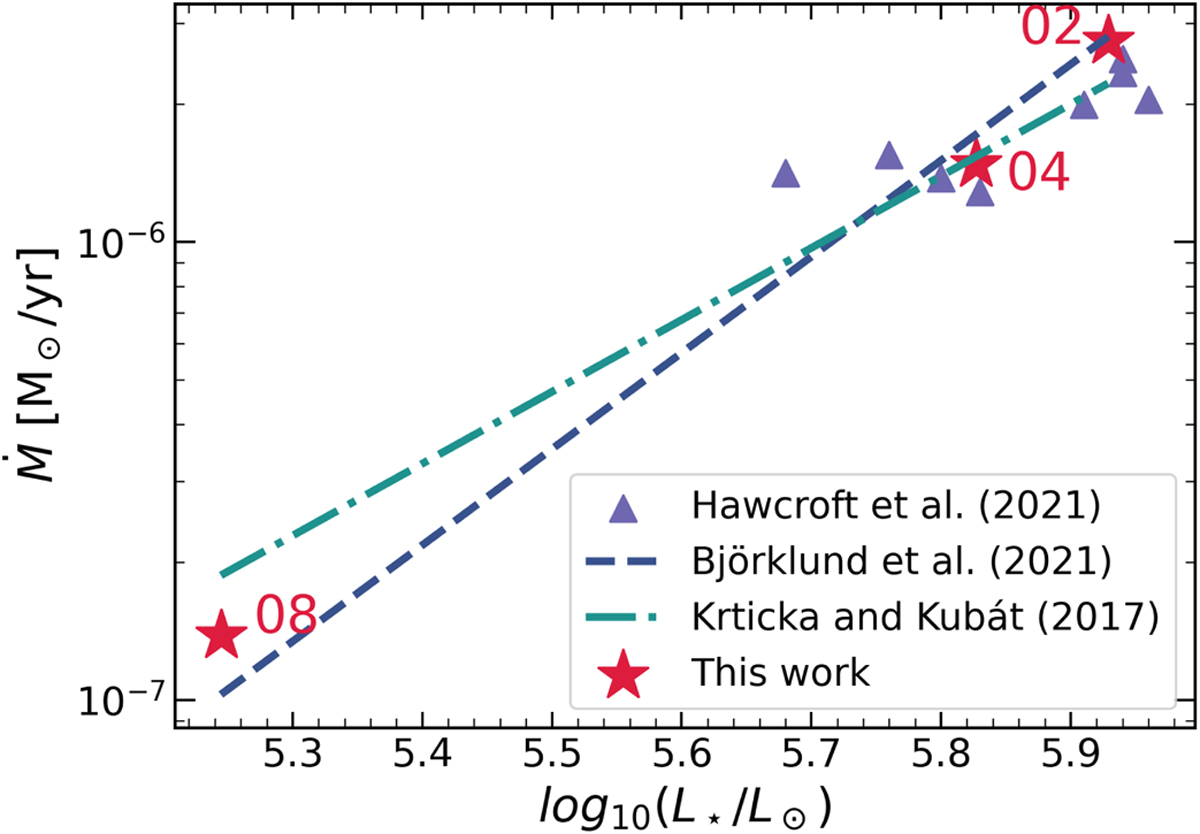
Mass loss rates in M⊙ yr−1 as a function of solar luminosity. The ★-markers are the mass loss rates calculated from the models considered in this work, whereas the dot-dashed line using Krtička & Kubát (2017), and the dashed line is calculated using Björklund et al. (2021). The triangle markers are plotted from the empirical mass loss rate study by Hawcroft et al. (2021; their optically thick GA rates).
Current usage metrics show cumulative count of Article Views (full-text article views including HTML views, PDF and ePub downloads, according to the available data) and Abstracts Views on Vision4Press platform.
Data correspond to usage on the plateform after 2015. The current usage metrics is available 48-96 hours after online publication and is updated daily on week days.
Initial download of the metrics may take a while.