Open Access
Fig. 15
Download original image
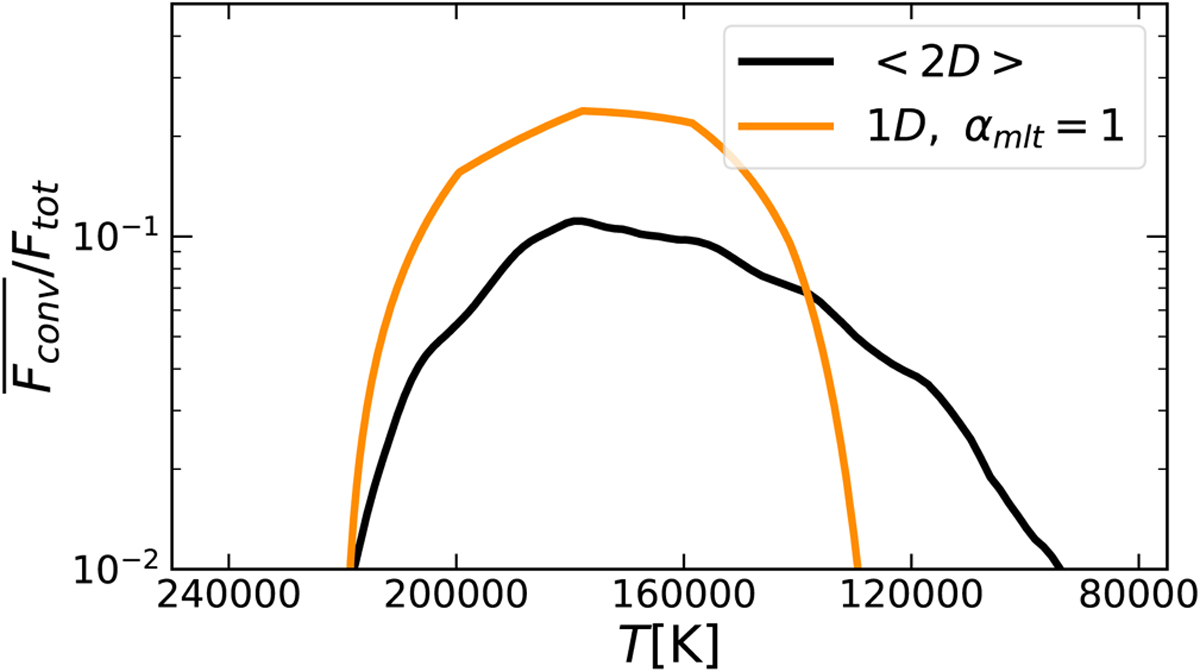
Convective flux to the total flux as a function of temperature for the O4 model. The black curve is the 〈2D〉, and the orange curve is the calibrated 1D model to match the 2D with αMLT = 1.
Current usage metrics show cumulative count of Article Views (full-text article views including HTML views, PDF and ePub downloads, according to the available data) and Abstracts Views on Vision4Press platform.
Data correspond to usage on the plateform after 2015. The current usage metrics is available 48-96 hours after online publication and is updated daily on week days.
Initial download of the metrics may take a while.