Fig. 13
Download original image
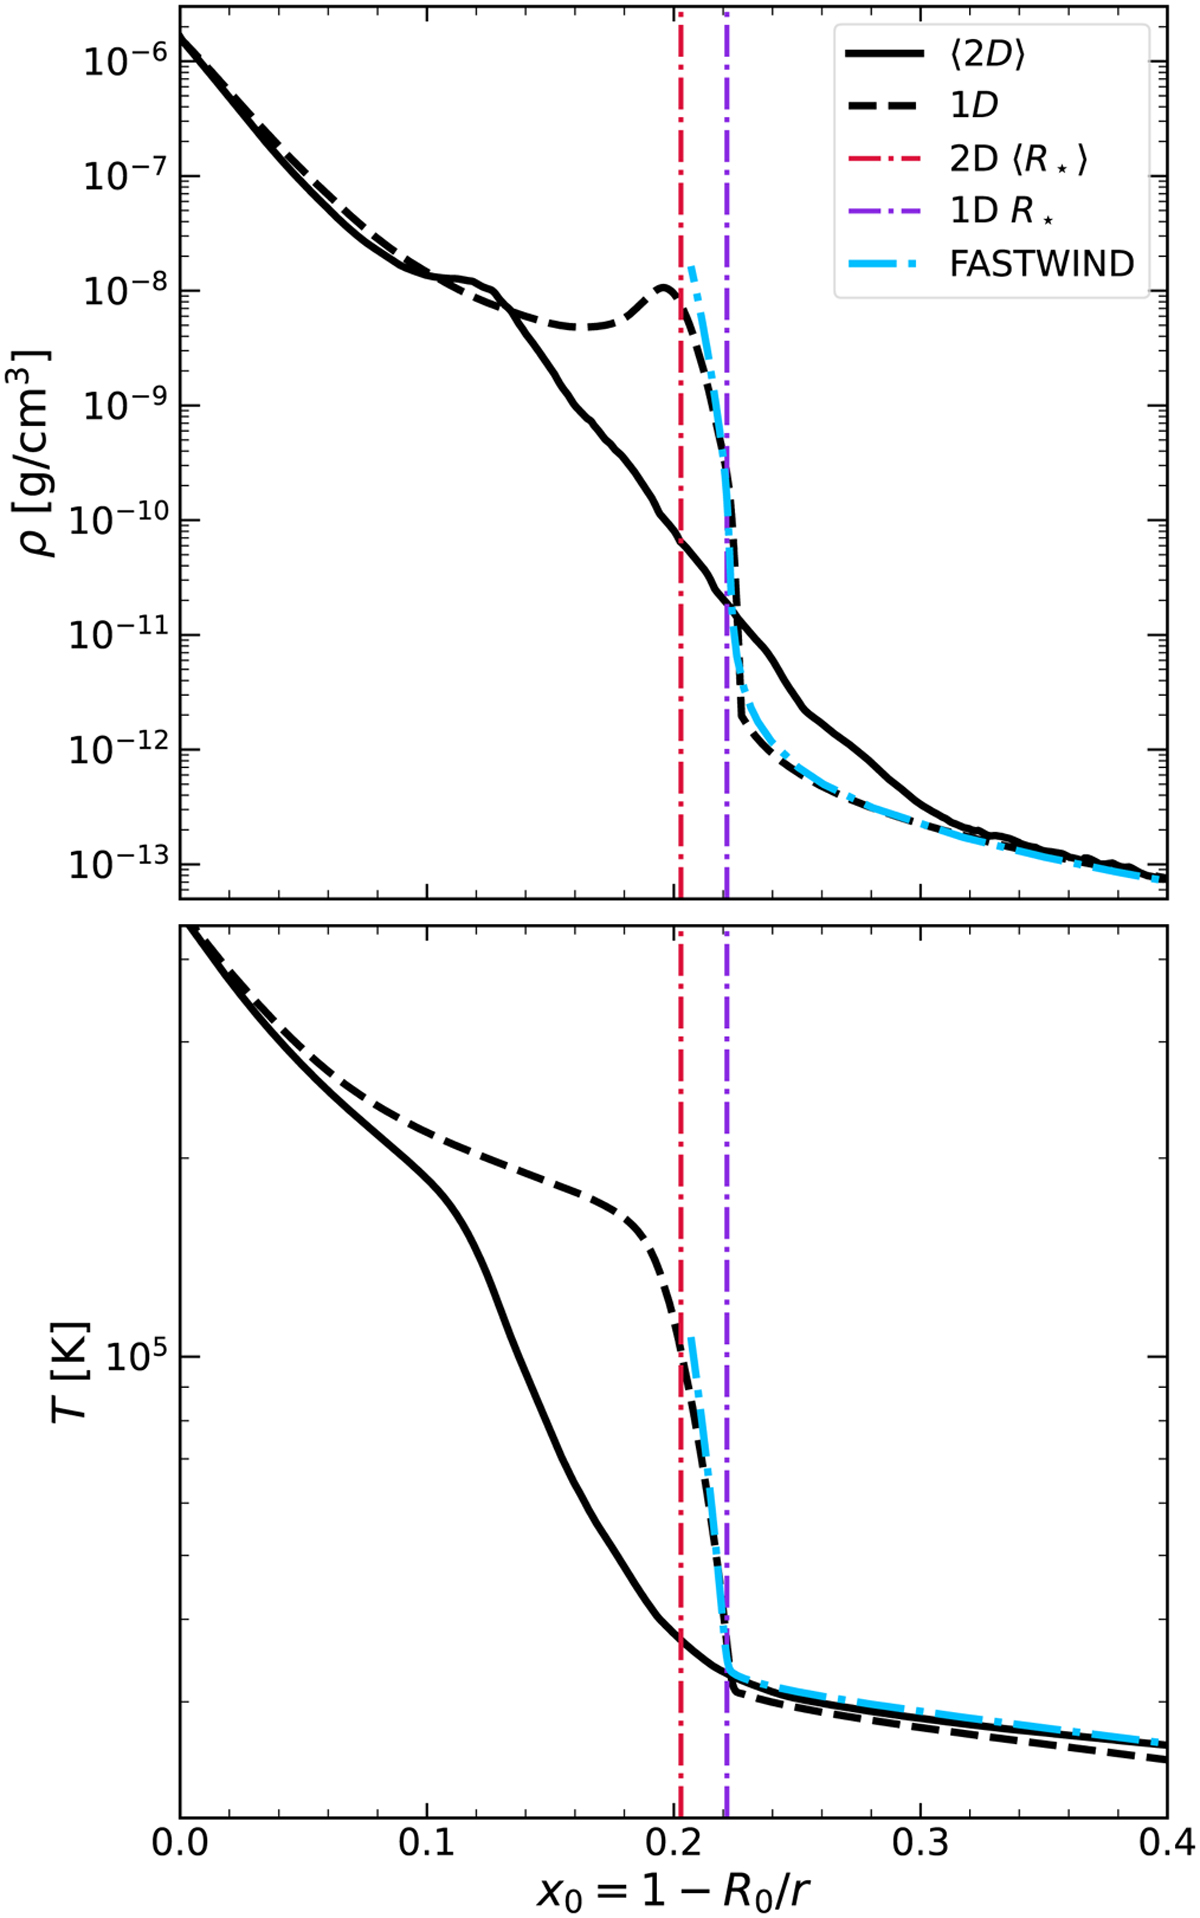
Initial 1D and resulting 〈2D〉 gas density [in g cm−3] (top) and temperature [in K] (bottom) structure for the O4 model as a function of modified radius x = 1 − R0/r, with R0 as the lower boundary radius. The ‘red dash-dotted’ line is the 〈2D〉 photosphere and the ‘blue dash-dotted’ is the 1D photosphere. The cyan dash-dotted curve is produced using FASTWIND as described with specifications in Sect. 2.3.
Current usage metrics show cumulative count of Article Views (full-text article views including HTML views, PDF and ePub downloads, according to the available data) and Abstracts Views on Vision4Press platform.
Data correspond to usage on the plateform after 2015. The current usage metrics is available 48-96 hours after online publication and is updated daily on week days.
Initial download of the metrics may take a while.