Fig. 12
Download original image
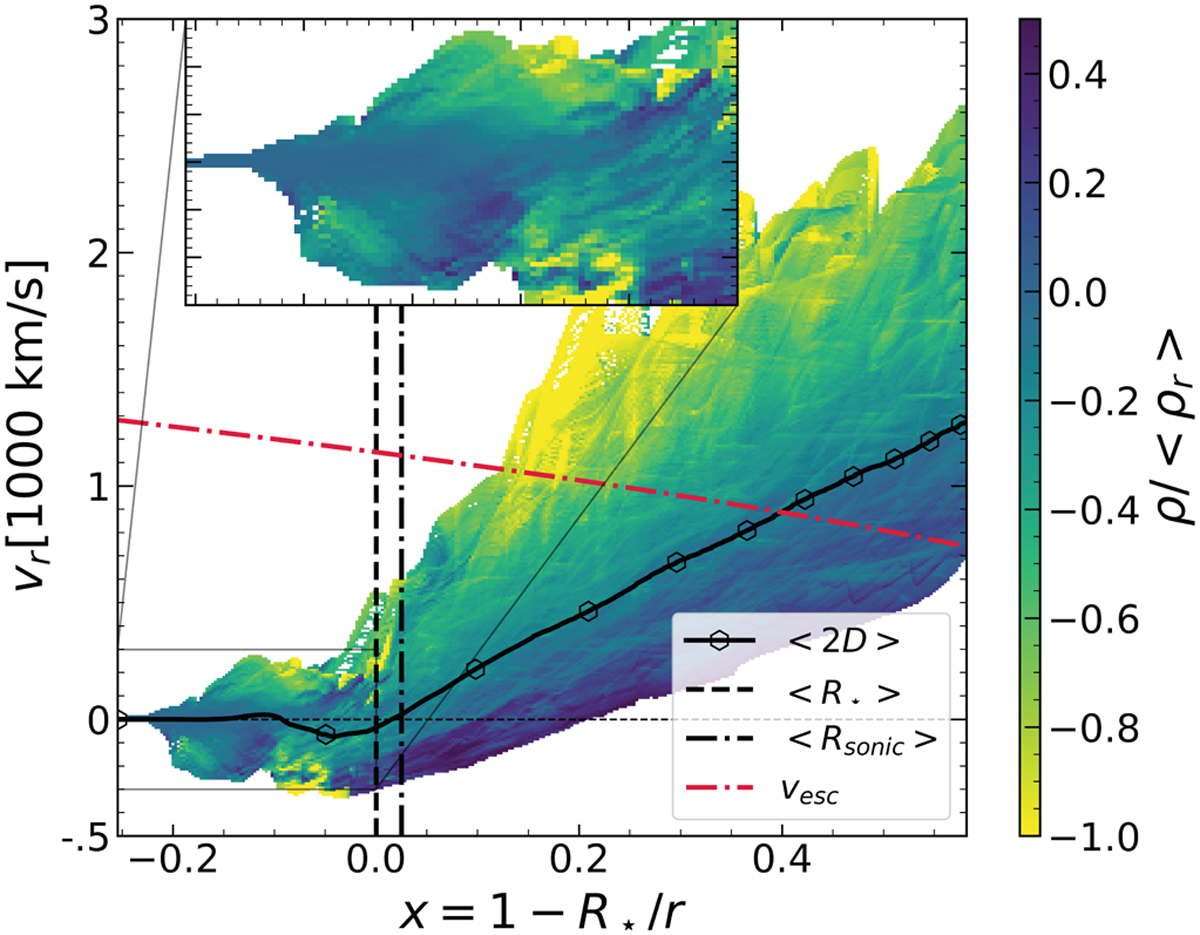
Average relative density for each radial velocity at different radii for the O4 model. 〈ρr〉 is the average density at every radial cell. Colours here represent relative density (ρ/〈ρr〉) with yellow displaying under-dense regions and blue representing over-dense clumps. The red dash-dotted line indicates the local escape velocity, the black dashed vertical line is the average photosphere 〈R★〉 and the black dash-dotted vertical line is the average sonic point 〈Rsonic〉. The zoomed-in part highlights the regions below the optical photosphere.
Current usage metrics show cumulative count of Article Views (full-text article views including HTML views, PDF and ePub downloads, according to the available data) and Abstracts Views on Vision4Press platform.
Data correspond to usage on the plateform after 2015. The current usage metrics is available 48-96 hours after online publication and is updated daily on week days.
Initial download of the metrics may take a while.