Fig. 10
Download original image
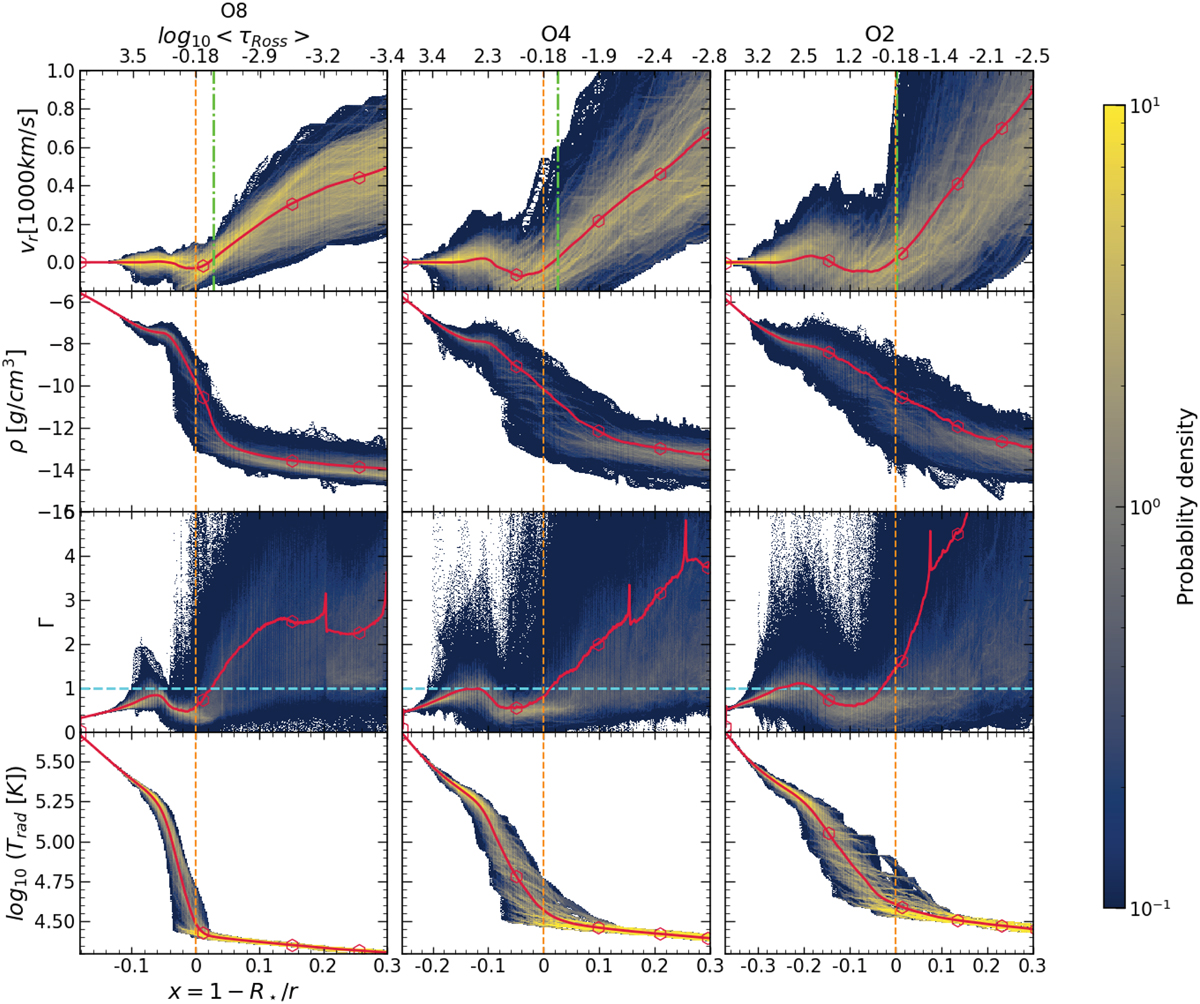
Probability density maps for different quantities, from top to bottom radial velocity, gas density, Eddington Γ, and radiation temperature for different models O8 (left), O4 (middle), and O2 (right). 40 snapshots have been used to create these probability density maps. The red curves represent the lateral-temporal averages. The vertical orange-dashed line is 〈R★〉, whereas the green dash-dotted vertical lines in the top panel are 〈Rsonic〉. The cyan horizontal lines in the Γ panels are where its value is unity. The colours signify the probability of finding a quantity at a certain cell, with yellow having a higher probability and blue having a lower one.
Current usage metrics show cumulative count of Article Views (full-text article views including HTML views, PDF and ePub downloads, according to the available data) and Abstracts Views on Vision4Press platform.
Data correspond to usage on the plateform after 2015. The current usage metrics is available 48-96 hours after online publication and is updated daily on week days.
Initial download of the metrics may take a while.