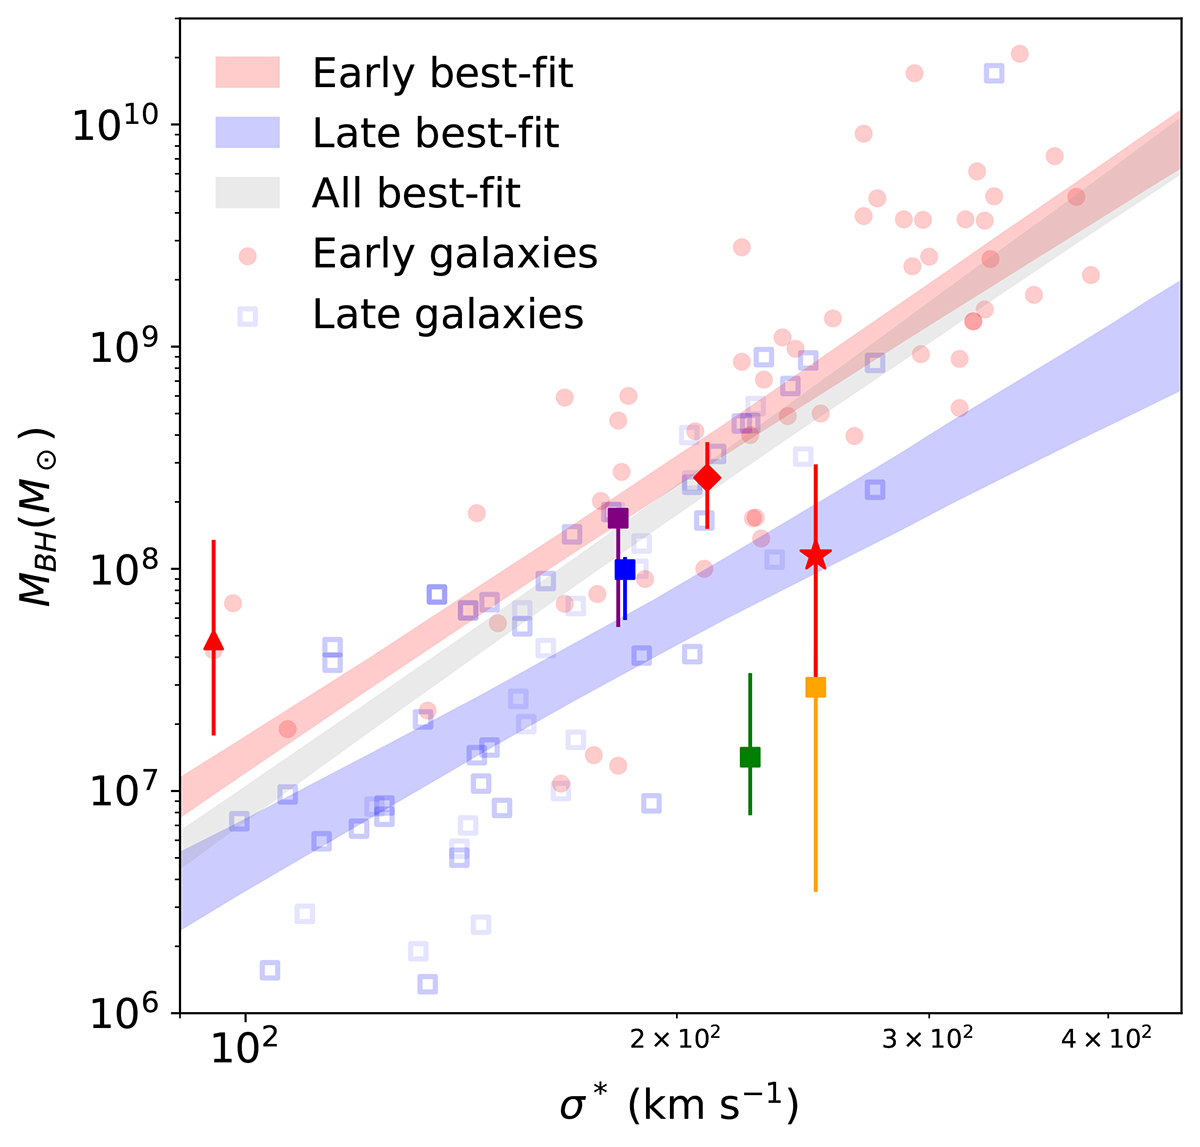
Fig. 9.
Download original image
Plot showing BH mass vs stellar velocity dispersion (MBH-σ* relation). The symbols of our 7 AGNs are similar to that of Fig. 8. The figure is redrawn from Fig. 3 of Greene et al. (2020), but with the addition of the 4 targets introduced in this work. Early- and late-type galaxies are shown as red circles and blue hollow squares, respectively, while BH mass upper limits of some low-mass late-type galaxies are shown as inverted blue triangles. All these galaxies’ measurements are taken from Greene et al. (2020) and referenced therein. The best-fit MBH-σ* relation for early- and late-type galaxies are shown as red and blue-shaded regions, while the best-fit relation for all galaxies is shown as a grey-shaded region. The best-fit lines are surrounded with their 1σ confidence interval, and all best-fit values are also taken from Greene et al. (2020).
Current usage metrics show cumulative count of Article Views (full-text article views including HTML views, PDF and ePub downloads, according to the available data) and Abstracts Views on Vision4Press platform.
Data correspond to usage on the plateform after 2015. The current usage metrics is available 48-96 hours after online publication and is updated daily on week days.
Initial download of the metrics may take a while.