Fig. 8.
Download original image
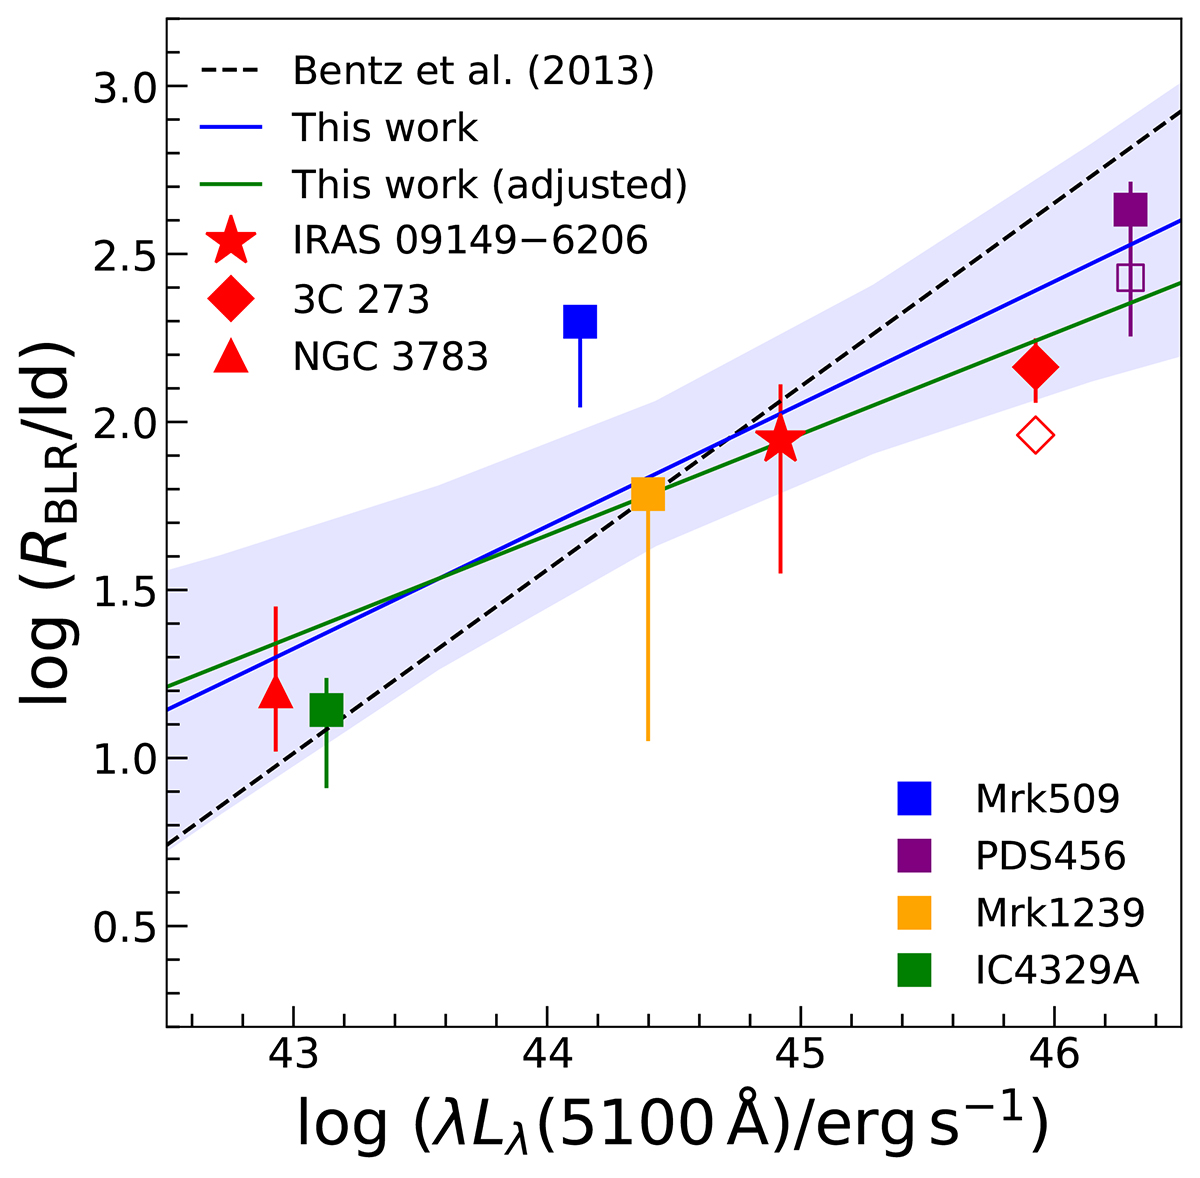
Logarithm of the BLR radius as a function of log λLλ(5100 Å) (R-L relation). The blue line shows the best-fit line derived from all 7 GRAVITY-observed AGNs, and the blue shaded region is its 1σ confidence interval. The AGN luminosity is taken from Table 1. The dashed line represents the best-fit radius luminosity relation from Bentz et al. (2013). The 3 published AGNs (IRAS 09149-6206 from GRAVITY Collaboration 2020a, 3C 273 from GRAVITY Collaboration 2018, and NGC 3783 from GRAVITY Collaboration 2021a) are shown as a red star, red diamond, and red square, respectively. Our 4 targets are shown in differently coloured filled squares with 1σ errors. Our best-fit R-L (power-law) relation has a slope of ![]() , which is lower but, given the current large uncertainty, still consistent within uncertainties with the slope of R-L relation fit from Bentz et al. (2013;
, which is lower but, given the current large uncertainty, still consistent within uncertainties with the slope of R-L relation fit from Bentz et al. (2013; ![]() ). If we follow the prescription from photoionisation models, the BLR sizes of 3C 273 and PDS 456 will be adjusted (shown as open symbols), and the fitted GRAVITY R-L relation is shown as the green line.
). If we follow the prescription from photoionisation models, the BLR sizes of 3C 273 and PDS 456 will be adjusted (shown as open symbols), and the fitted GRAVITY R-L relation is shown as the green line.
Current usage metrics show cumulative count of Article Views (full-text article views including HTML views, PDF and ePub downloads, according to the available data) and Abstracts Views on Vision4Press platform.
Data correspond to usage on the plateform after 2015. The current usage metrics is available 48-96 hours after online publication and is updated daily on week days.
Initial download of the metrics may take a while.