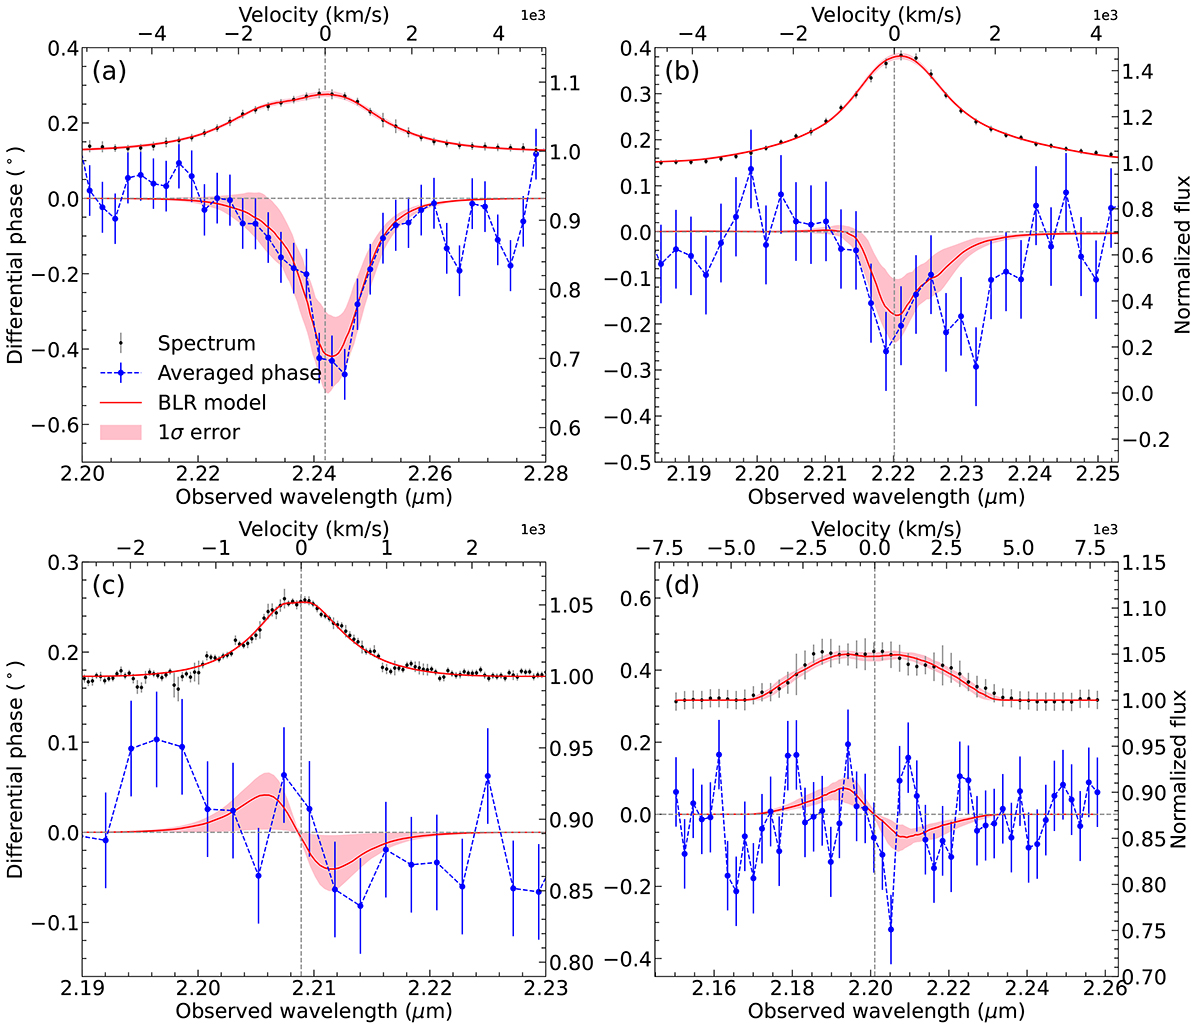
Fig. 6.

Download original image
Summary of BLR fitting results for (a) Mrk 509, (b) PDS 456, (c) Mrk 1239, and (d) IC 4329A. The observed averaged differential phase spectra with the continuum phase signal removed are shown in blue, while the median differential phase spectra from the best-fit BLR model are shown in red (see text for the details of averaging the differential phase spectra for each target). Above each panel, the observed line profile (black) is shown together with the median best-fit model line profile (red). The central wavelengths of the line profiles are shown by the grey vertical dashed lines. The red-shaded region shows the 16-to-84 percentiles of the averaged differential phase spectra and flux spectra from the best-fit model, which was created by getting randomly selected samples of each parameter in 100 different instances and then recreating the averaged differential phase spectra. Mrk 509 and PDS 456 clearly show an asymmetrical signal typical for the Pancoast model, while Mrk 1239 and IC 4329A show the S-shape signal typical for the Keplerian model.
Current usage metrics show cumulative count of Article Views (full-text article views including HTML views, PDF and ePub downloads, according to the available data) and Abstracts Views on Vision4Press platform.
Data correspond to usage on the plateform after 2015. The current usage metrics is available 48-96 hours after online publication and is updated daily on week days.
Initial download of the metrics may take a while.


