Fig. 5.

Download original image
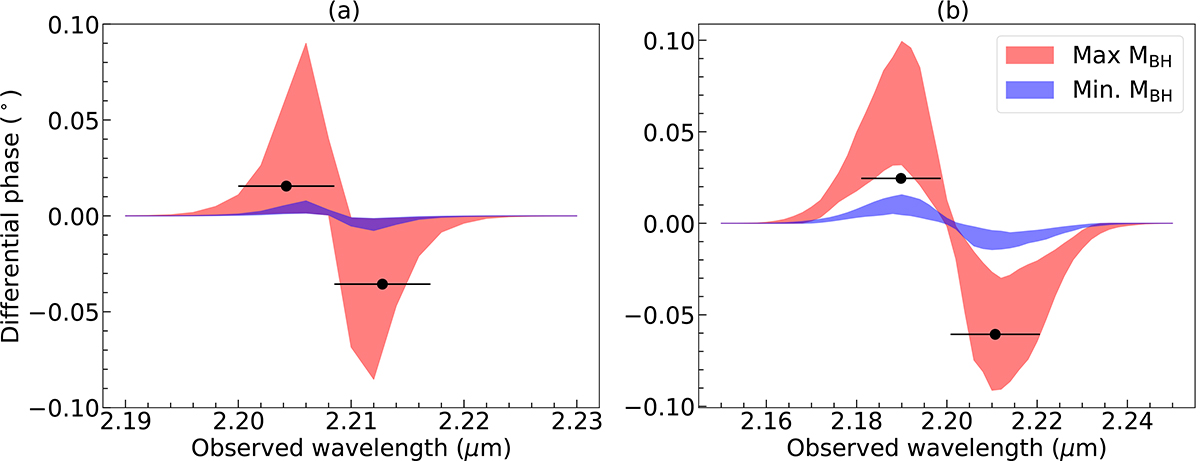
Expected differential phase signals for Mrk 1239 (left panel) and IC 4329A (right panel) when their line profiles were fitted with our circular model assuming their maximum (red shaded region) and minimum (blue shaded region) BH masses were fixed during fitting. The assumed BH masses for Mrk 1239 and IC 4329A are taken from previous literature as discussed in the text. The shaded regions refer to 1σ uncertainty. The chosen baselines to average are the same as the ones used to create Fig. 6: UT4-UT3, UT4-UT2, and UT4-UT1 for Mrk 1239; UT4-UT2, UT4-UT1, and UT3-UT2 for IC 4329A. The black points refer to the maximum and minimum observed phase signals at the line region of Mrk 1239 and IC 4329A after averaging the differential phase spectra from the same chosen baselines. The horizontal lines show the wavelength range of the maximum and minimum observed phase signals.
Current usage metrics show cumulative count of Article Views (full-text article views including HTML views, PDF and ePub downloads, according to the available data) and Abstracts Views on Vision4Press platform.
Data correspond to usage on the plateform after 2015. The current usage metrics is available 48-96 hours after online publication and is updated daily on week days.
Initial download of the metrics may take a while.


