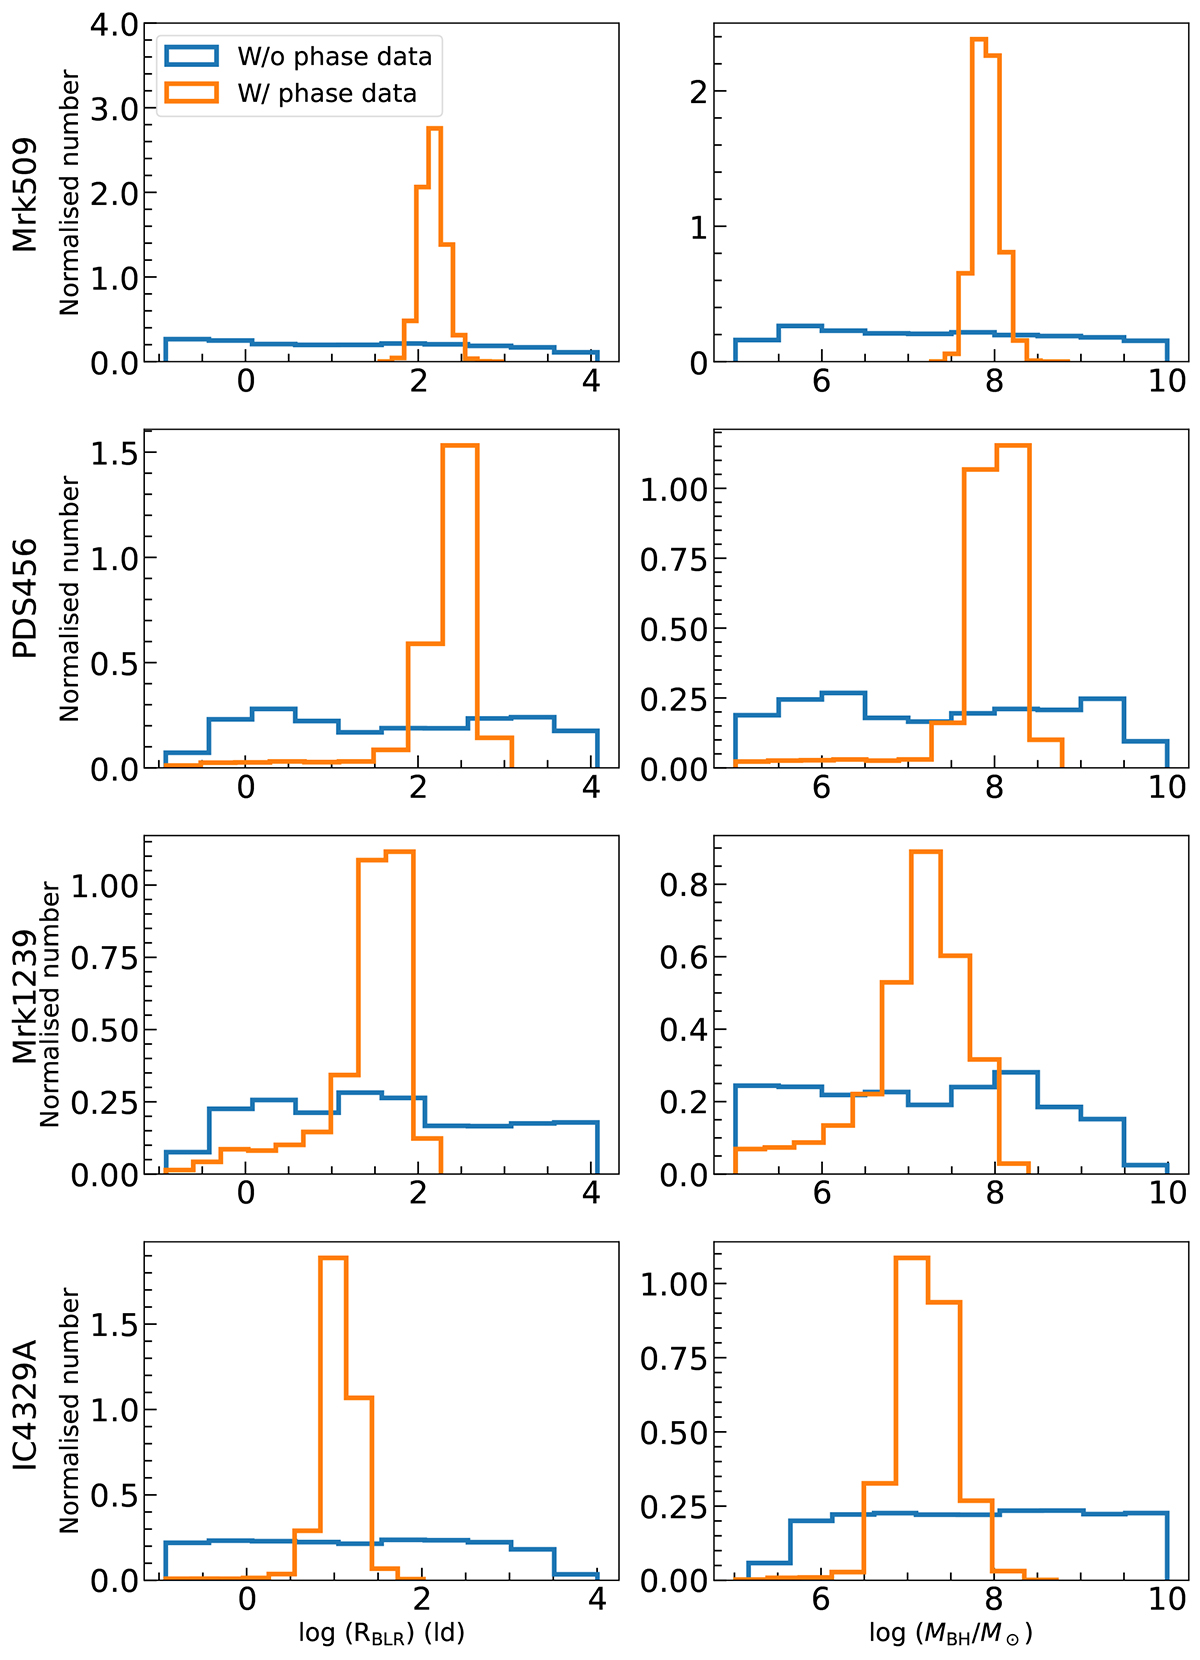
Fig. 4.
Download original image
Posterior distributions of BLR radius (left column) and BH mass (right column) resulting from BLR fitting without differential phase data (blue histogram) and with differential phase data (orange histogram). Each row corresponds to each target; from top to bottom: Mrk 509, PDS 456, Mrk 1239, and IC 4329A. The histograms are normalised such that they integrate into 1. It is clear that the spatial information from the differential phase significantly constrains both the BLR radius and BH mass.
Current usage metrics show cumulative count of Article Views (full-text article views including HTML views, PDF and ePub downloads, according to the available data) and Abstracts Views on Vision4Press platform.
Data correspond to usage on the plateform after 2015. The current usage metrics is available 48-96 hours after online publication and is updated daily on week days.
Initial download of the metrics may take a while.