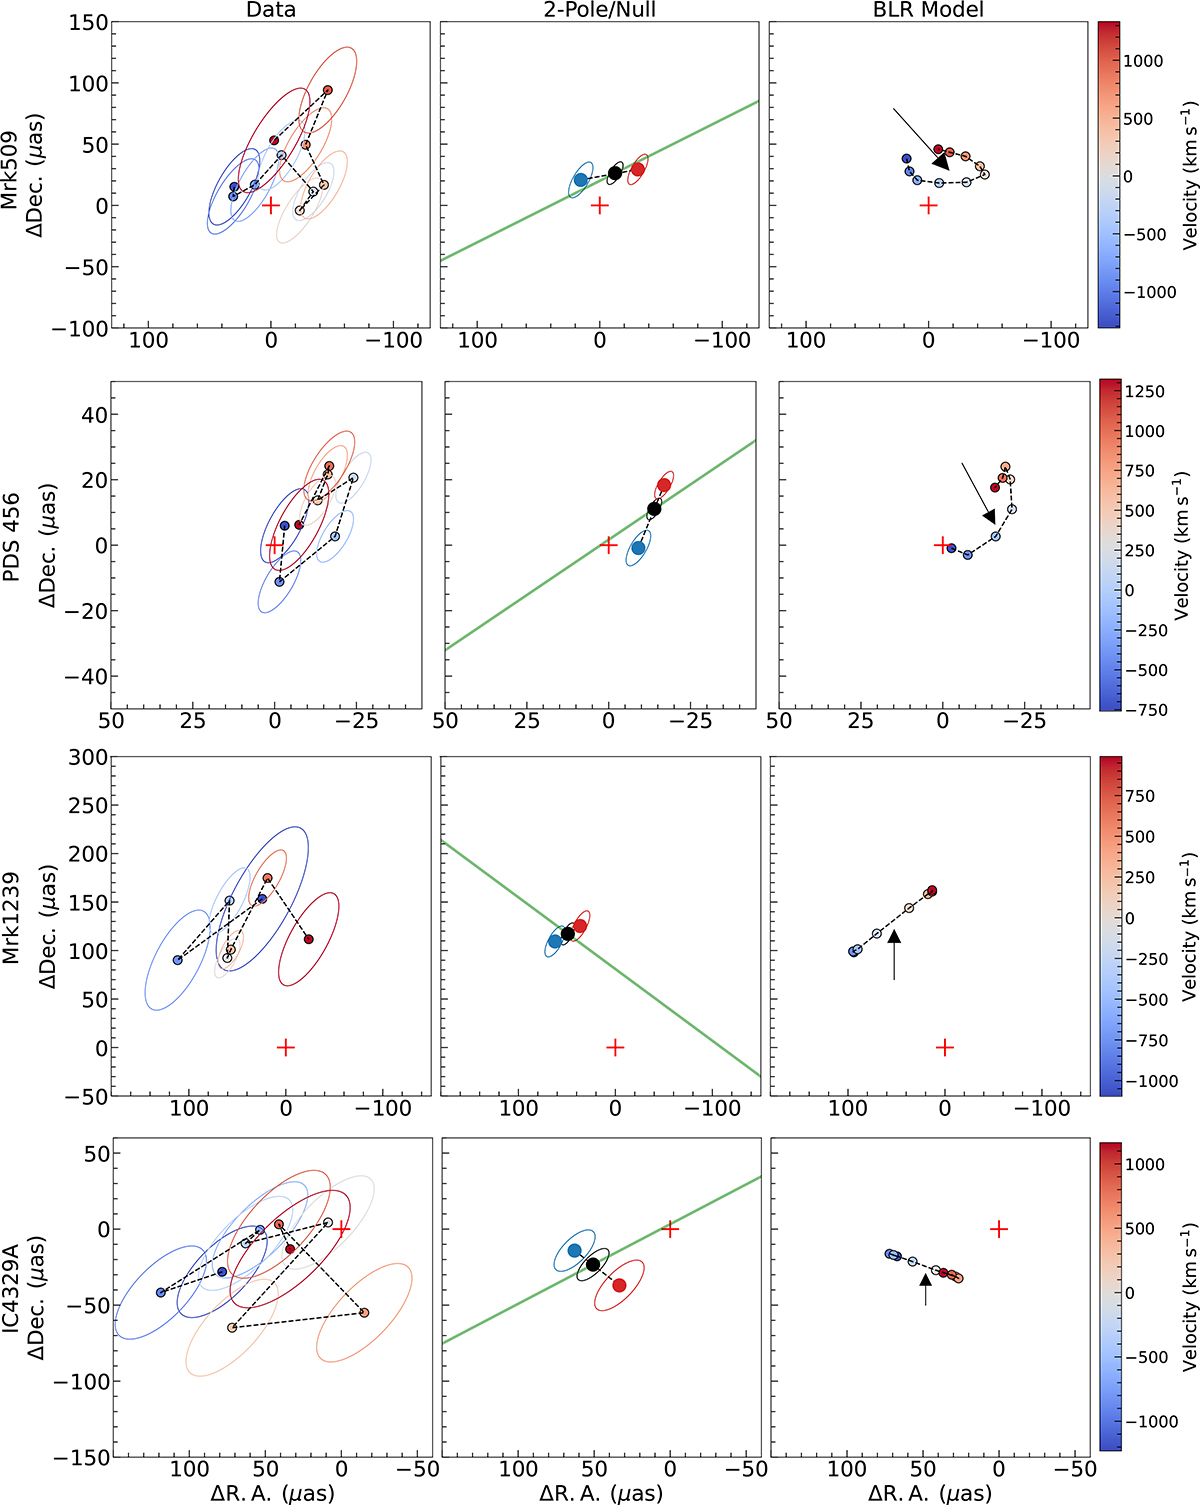
Fig. 3.
Download original image
Best-fit BLR photocentres of our four targets. The columns from left to right show the photocentres from the data, the “2-pole” and “null” photocentre models (described in Sect. 4), and the photocentres from the best-fit BLR model of each target. The red cross refers to the continuum photocentre. The direction of the radio jet is shown as a green solid line. The black arrow shows the position of the best-fit “null” model fitted from the best-fit BLR model. The ellipses around each centroid refer to 68% (1σ) confidence intervals. The colours refer to the corresponding velocity of each spectral channel. The (significant) separation of the red- and blueshifted photocentres confirm that we have resolved the BLRs of our targets. For Mrk 1239 and IC 4329A, the perpendicular alignment between the radio jet and red-blue photo centres from the “2-pole” model fitting of the data and the straight alignments of their model photo centres indicate that their BLR is rotation-dominated. On the other hand, for Mrk 509 and PDS 456, the radio jet and red-blue photocentres are not closely perpendicular, and the model photocentres are curved, which suggests that their BLRs are radial motion-dominated.
Current usage metrics show cumulative count of Article Views (full-text article views including HTML views, PDF and ePub downloads, according to the available data) and Abstracts Views on Vision4Press platform.
Data correspond to usage on the plateform after 2015. The current usage metrics is available 48-96 hours after online publication and is updated daily on week days.
Initial download of the metrics may take a while.