Open Access
Fig. A.2
Download original image
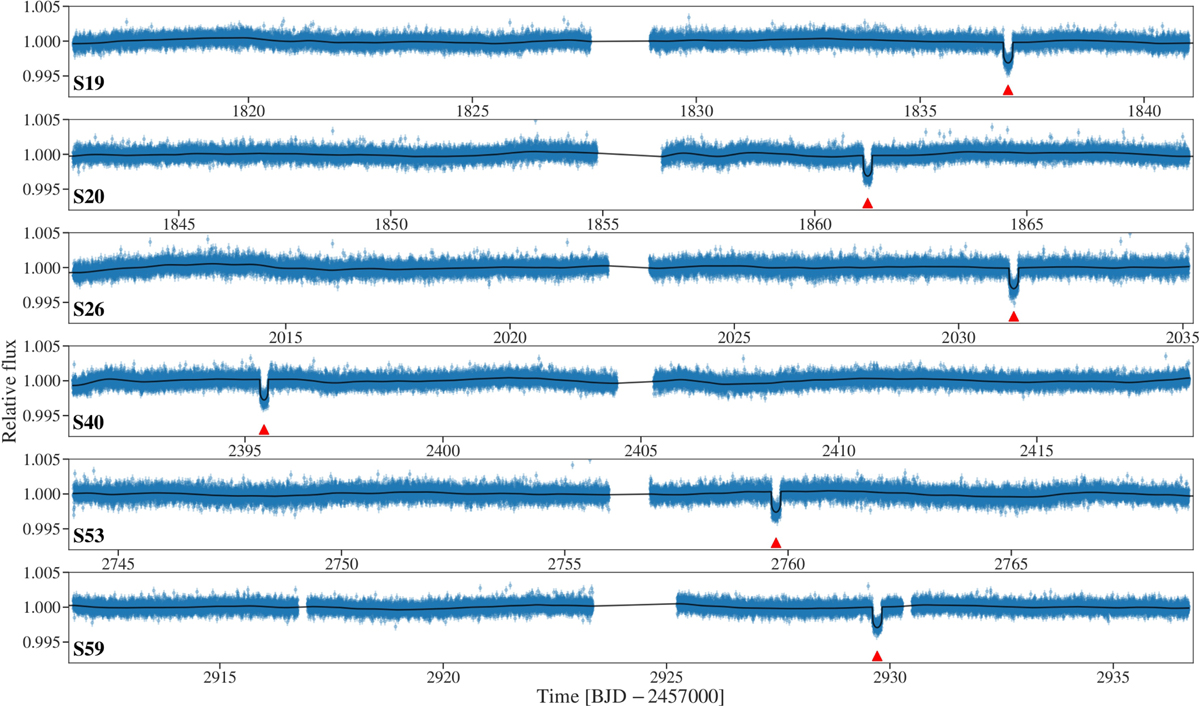
TOI-1710 2 min cadence light curve from TESS Sectors 19, 20, 26, 40, 53, and 59 (blue points with error bars) along with the transit plus GP model (black line) from juliet. Upward-pointing red triangles mark the TOI-1710b transits.
Current usage metrics show cumulative count of Article Views (full-text article views including HTML views, PDF and ePub downloads, according to the available data) and Abstracts Views on Vision4Press platform.
Data correspond to usage on the plateform after 2015. The current usage metrics is available 48-96 hours after online publication and is updated daily on week days.
Initial download of the metrics may take a while.