Open Access
Fig. 5
Download original image
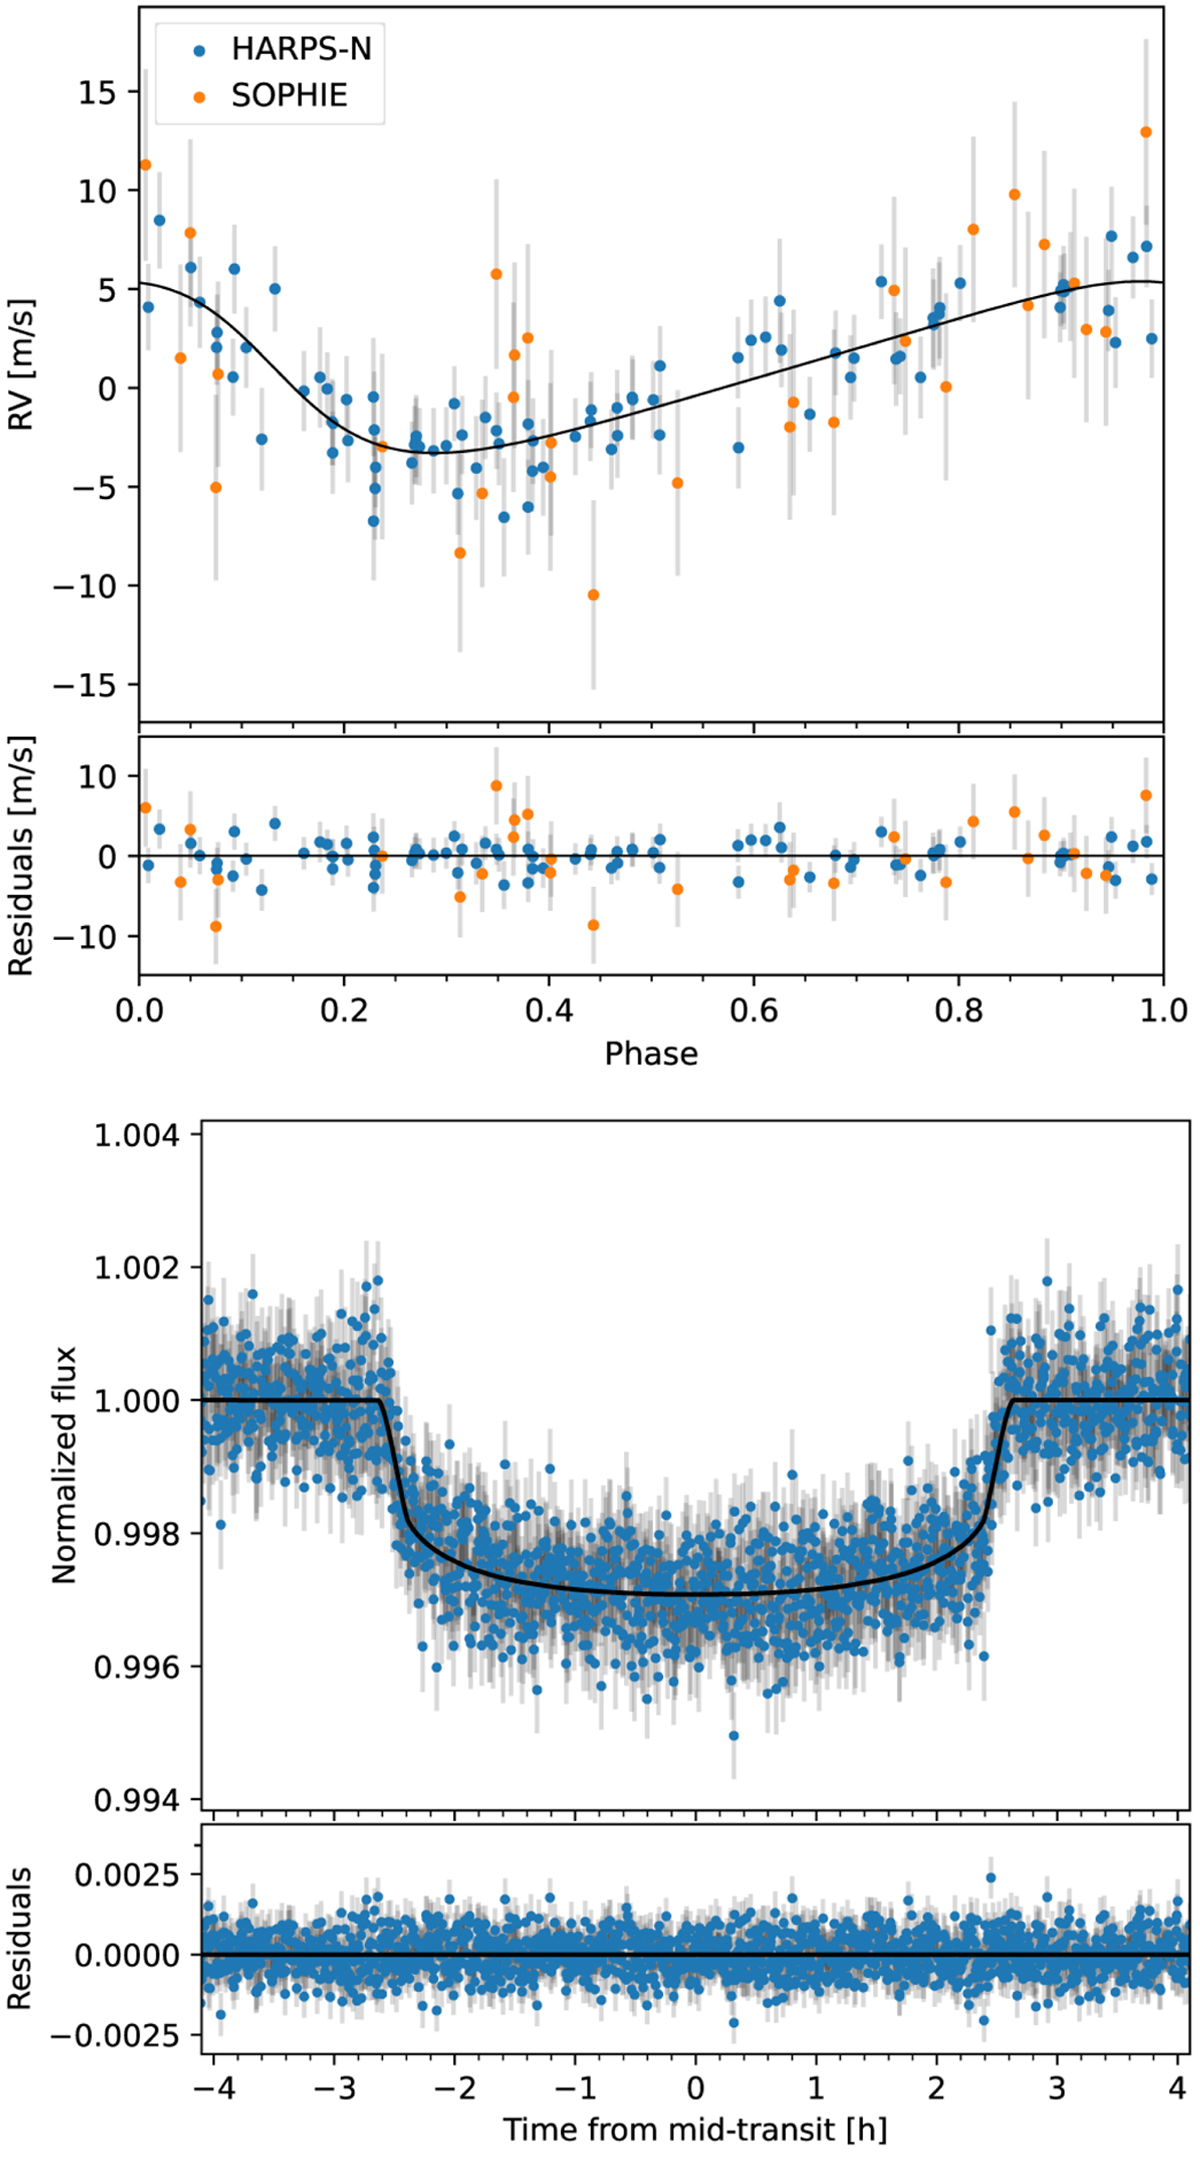
Phase-folded RV (top) and TESS (bottom) data for TOI-1710b. Upper panel: HARPS-N (blue) and SOPHIE (orange) RV data with the overplotted fit from the 1pGP model. Lower panel: combination of TESS transits from Sectors 19, 20, 26, 26, 40, 53, and 59. The black line is the inferred 1pGP model.
Current usage metrics show cumulative count of Article Views (full-text article views including HTML views, PDF and ePub downloads, according to the available data) and Abstracts Views on Vision4Press platform.
Data correspond to usage on the plateform after 2015. The current usage metrics is available 48-96 hours after online publication and is updated daily on week days.
Initial download of the metrics may take a while.