Fig. 4
Download original image
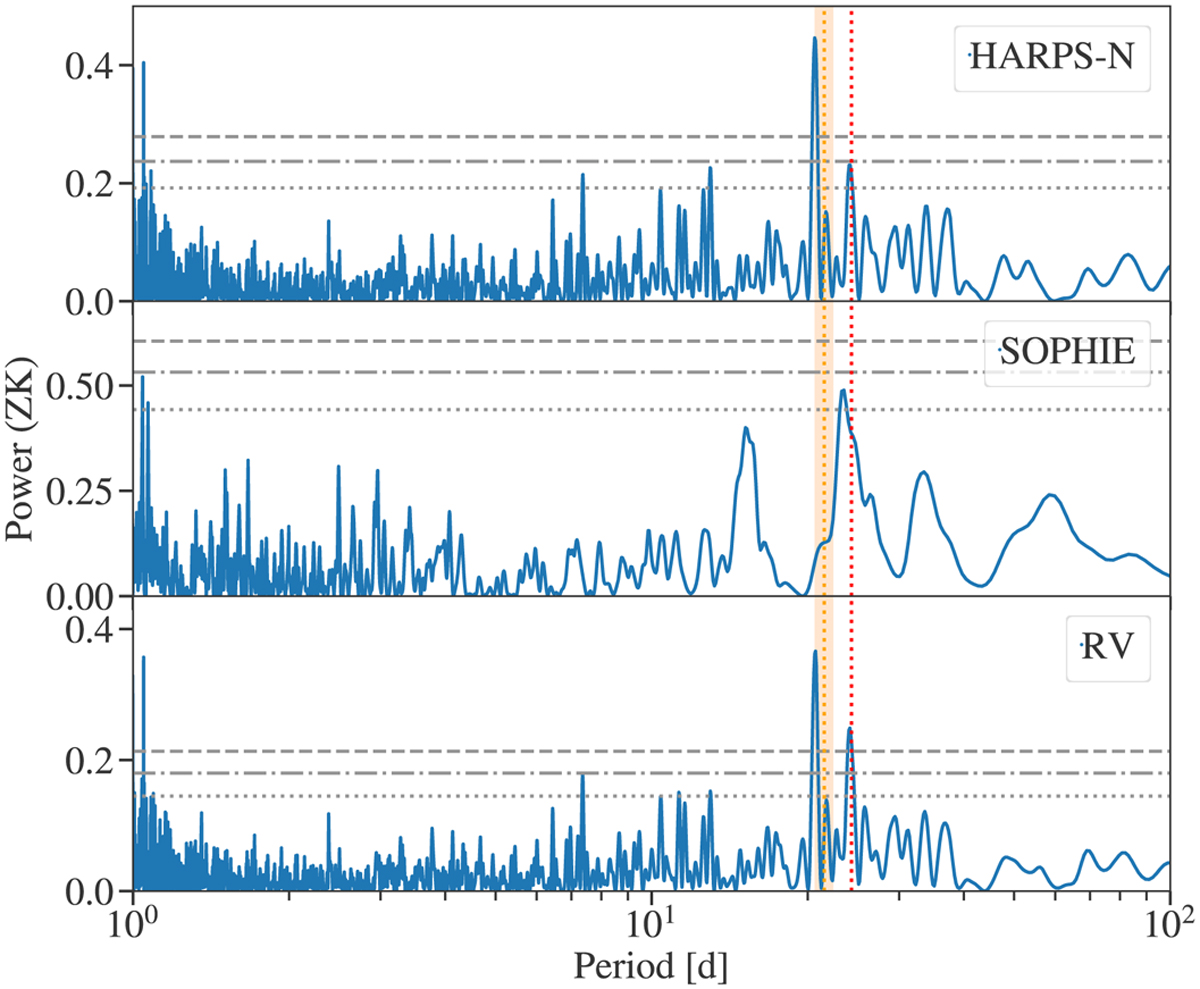
Generalized Lomb–Scargle periodograms of HARPS-N, SOPHIE, and combined RV measurements (from top to bottom). Vertical red dotted line indicates the period of TOI-1710b at 24.28 days. Shaded orange region indicates the 3σ region of the Prot from the joint fit (see Sect. 4.3). The graph shows 10%, 1% and 0.1% FAP levels in grey dotted, dash-dotted, and dashed, respectively.
Current usage metrics show cumulative count of Article Views (full-text article views including HTML views, PDF and ePub downloads, according to the available data) and Abstracts Views on Vision4Press platform.
Data correspond to usage on the plateform after 2015. The current usage metrics is available 48-96 hours after online publication and is updated daily on week days.
Initial download of the metrics may take a while.