Open Access
Fig. 2
Download original image
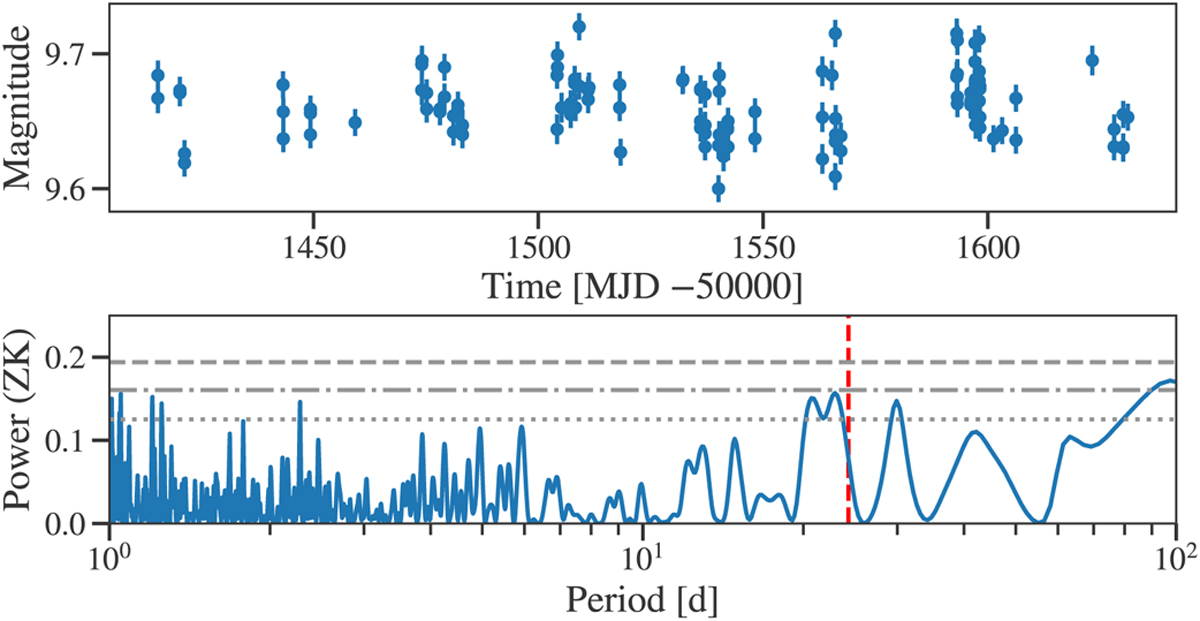
Dataset (top) and generalized Lomb-Scargle periodogram (bottom) of Northern Sky Variability Survey photometric data for TOI-1710. The vertical red dashed line marks the 24.28 d period. The 10%, 1%, and 0.1% FAP levels are indicated by horizontal grey dotted, dash-dotted, and dashed lines, respectively.
Current usage metrics show cumulative count of Article Views (full-text article views including HTML views, PDF and ePub downloads, according to the available data) and Abstracts Views on Vision4Press platform.
Data correspond to usage on the plateform after 2015. The current usage metrics is available 48-96 hours after online publication and is updated daily on week days.
Initial download of the metrics may take a while.