Open Access
Fig. B.2
Download original image
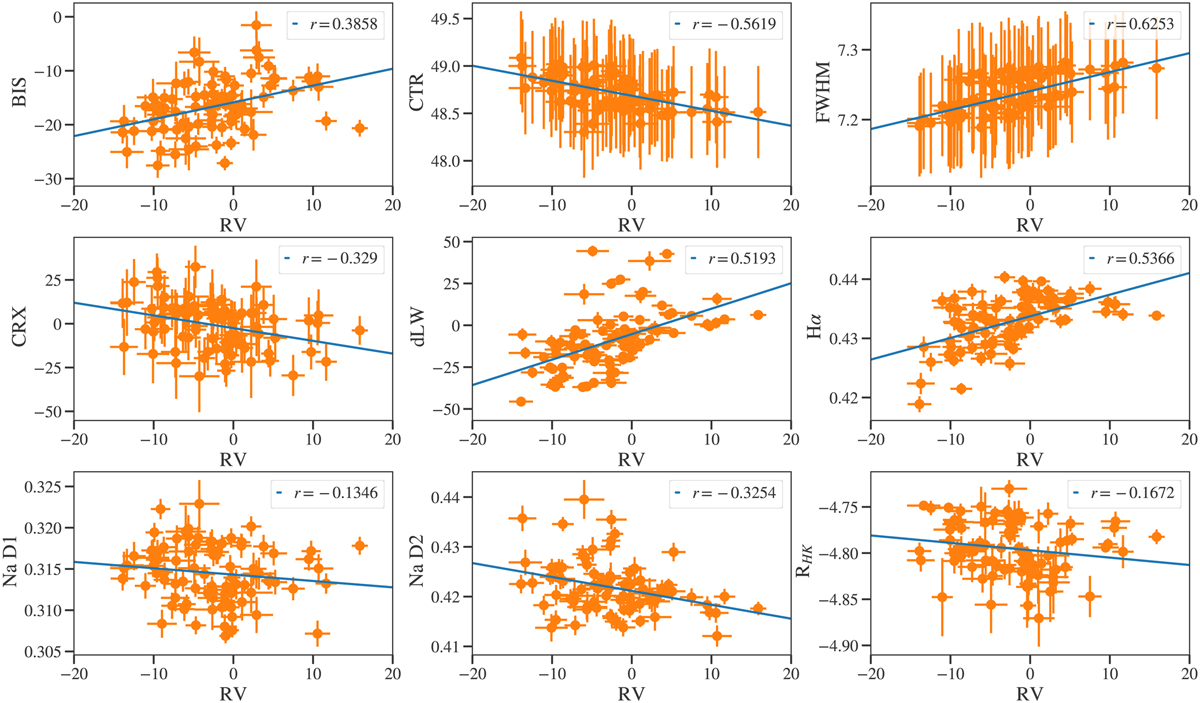
Correlation between HARPS-N RVs and the HARPS-N activity indicators (orange points with error bars). In each case a linear regression was performed (overplotted blue line) and the Pearson correlation r was computed, which is indicated.
Current usage metrics show cumulative count of Article Views (full-text article views including HTML views, PDF and ePub downloads, according to the available data) and Abstracts Views on Vision4Press platform.
Data correspond to usage on the plateform after 2015. The current usage metrics is available 48-96 hours after online publication and is updated daily on week days.
Initial download of the metrics may take a while.