Open Access
Fig. A.4
Download original image
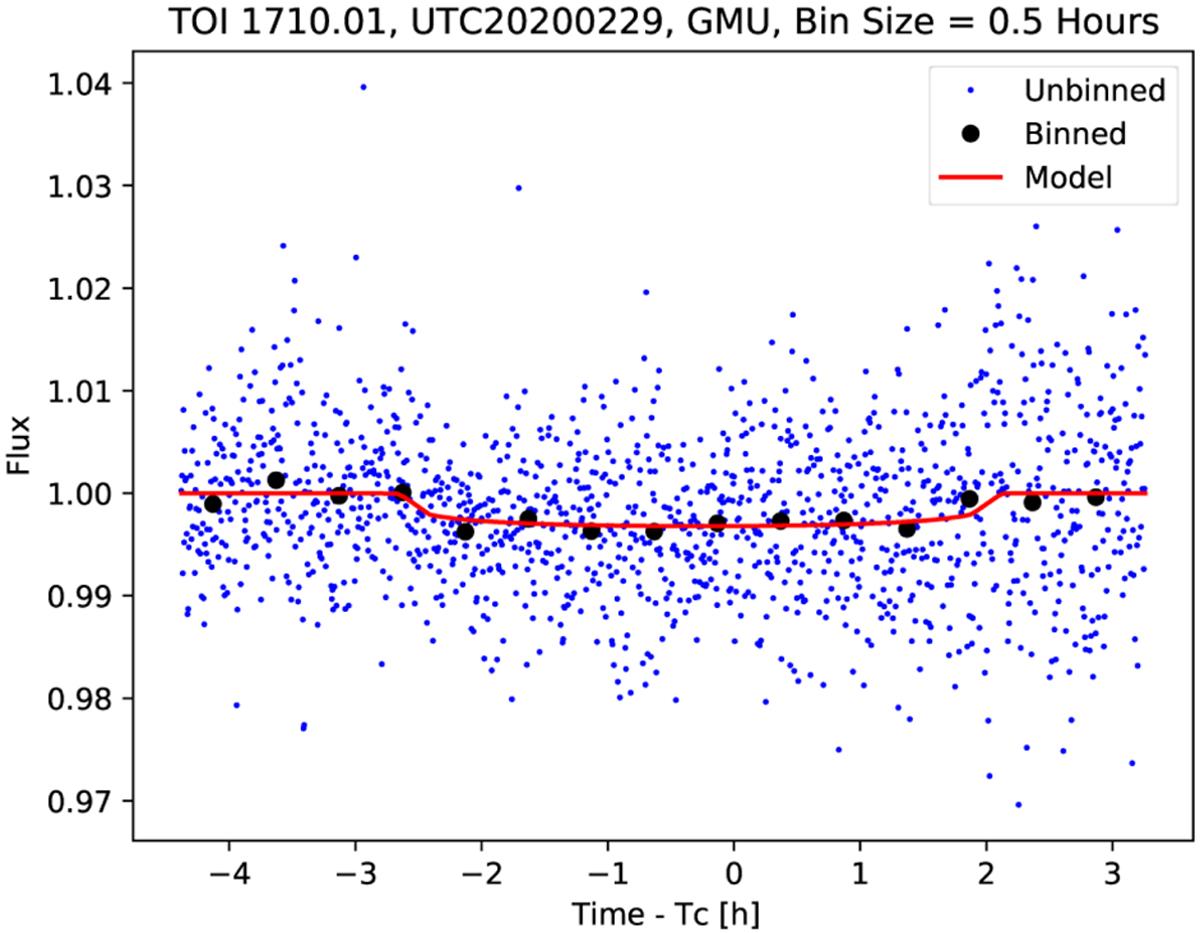
Light curve from the George Mason University Observatory’s 0.8 m telescope along with the best-fit transit model (red line). The blue points show the original photometric data with a cadence of 20 s; the black points show 30 min binned photometry.
Current usage metrics show cumulative count of Article Views (full-text article views including HTML views, PDF and ePub downloads, according to the available data) and Abstracts Views on Vision4Press platform.
Data correspond to usage on the plateform after 2015. The current usage metrics is available 48-96 hours after online publication and is updated daily on week days.
Initial download of the metrics may take a while.