Open Access
Fig. B.1
Download original image
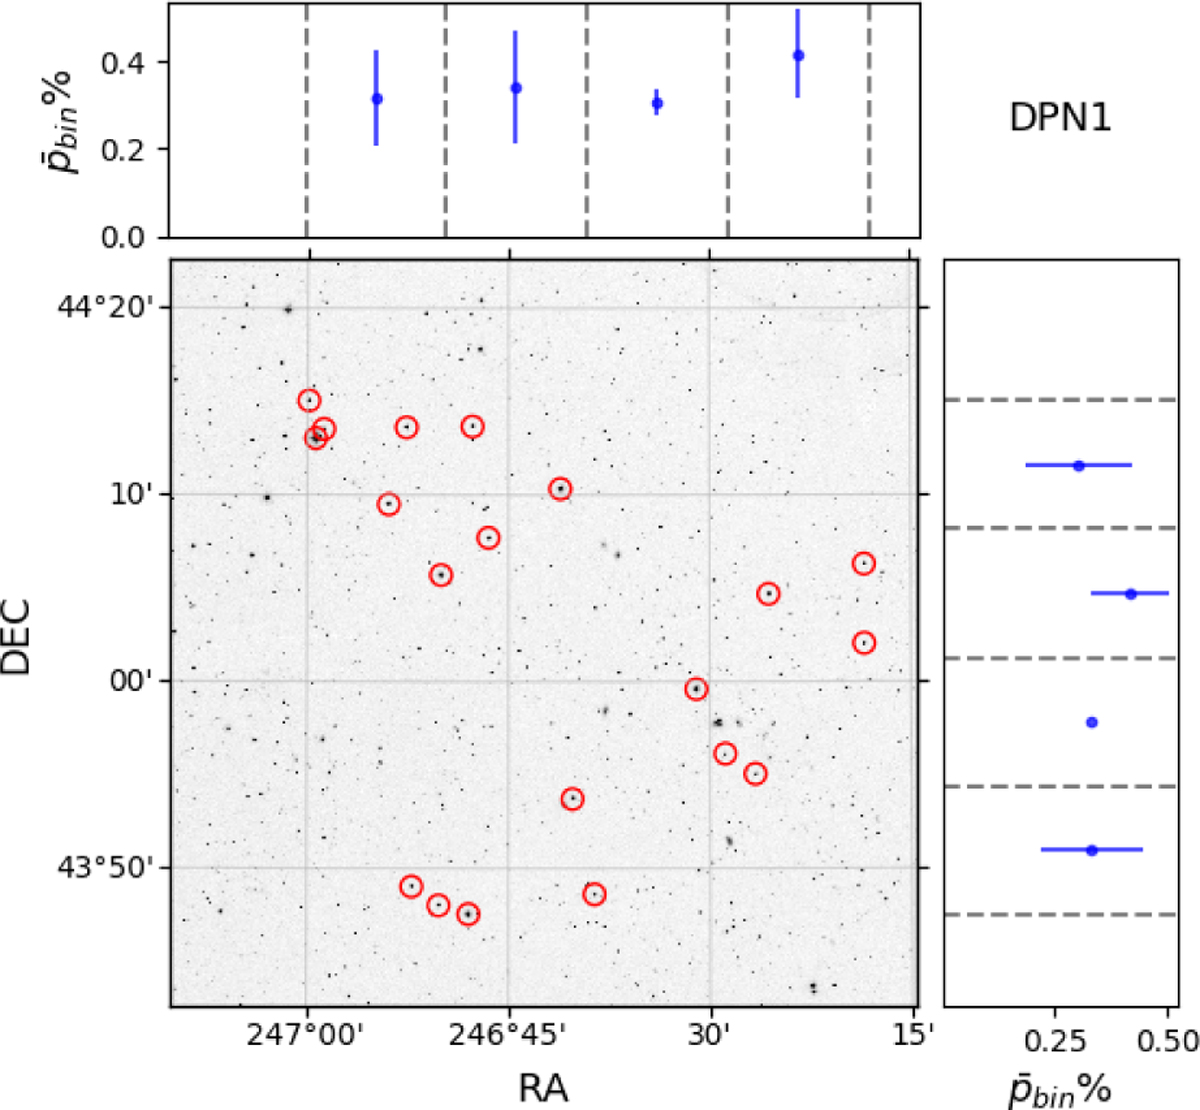
Observed stars in DPN1, marked with red circles. The RA and Dec range of the targets are divided in four equal bins. The blue points correspond to the average polarization of the stars within each bin. Errorbars represent the standard deviation of polarization measurements within each bin.
Current usage metrics show cumulative count of Article Views (full-text article views including HTML views, PDF and ePub downloads, according to the available data) and Abstracts Views on Vision4Press platform.
Data correspond to usage on the plateform after 2015. The current usage metrics is available 48-96 hours after online publication and is updated daily on week days.
Initial download of the metrics may take a while.