Fig. 1
Download original image
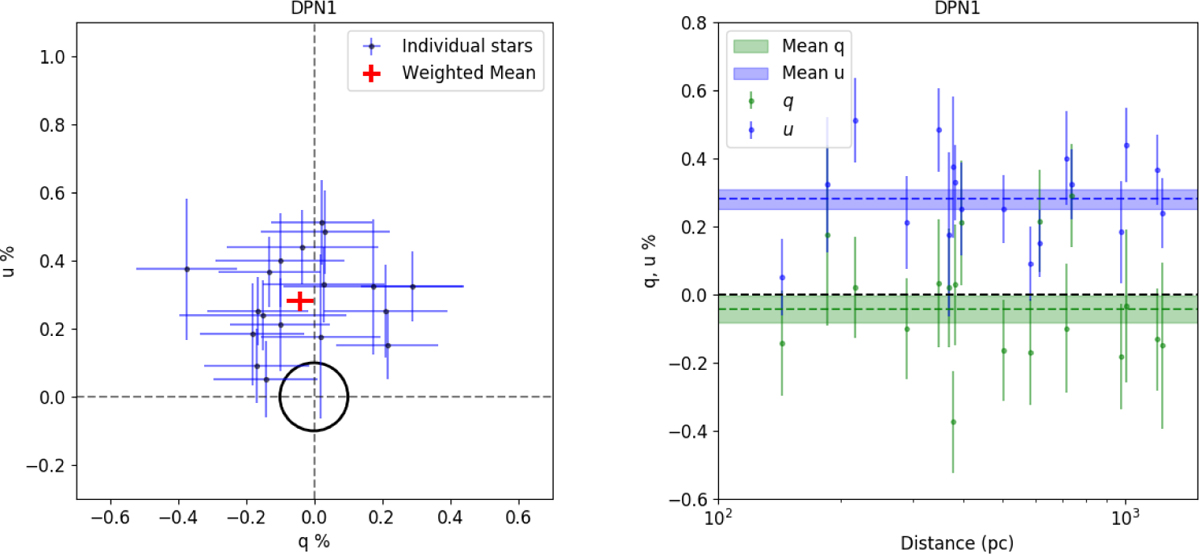
Polarization measurements of DPN1. Left: q − u measurements of individual stars of DPN1 (blue), together with the weighted mean and the error on the weighted mean (red). The black circle marks the value p = 0.1%. Right: q (green) and u (blue) measurements of the stars in the patch as a function of the distance from Earth. The green (blue) dashed line corresponds to the weighted mean q (u) of the patch and the green (blue) shaded region to its error on the weighted mean.
Current usage metrics show cumulative count of Article Views (full-text article views including HTML views, PDF and ePub downloads, according to the available data) and Abstracts Views on Vision4Press platform.
Data correspond to usage on the plateform after 2015. The current usage metrics is available 48-96 hours after online publication and is updated daily on week days.
Initial download of the metrics may take a while.