Open Access
Fig. 7
Download original image
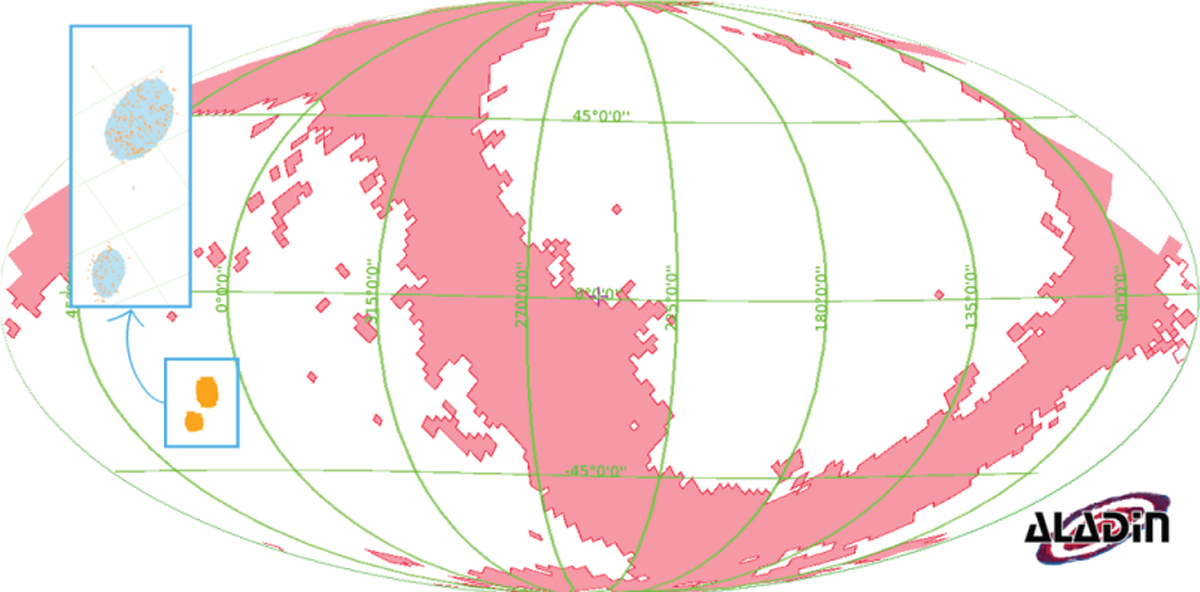
Interactive visualisation powered by Aladin Lite. The zoomed-in box displays in orange boxes the GLADE+ galaxies located within the 90% localisation volume (blue regions) of the GW190814 event. The plane of the Milky Way is shown with the red MOC map.
Current usage metrics show cumulative count of Article Views (full-text article views including HTML views, PDF and ePub downloads, according to the available data) and Abstracts Views on Vision4Press platform.
Data correspond to usage on the plateform after 2015. The current usage metrics is available 48-96 hours after online publication and is updated daily on week days.
Initial download of the metrics may take a while.