Open Access
Fig. 5
Download original image
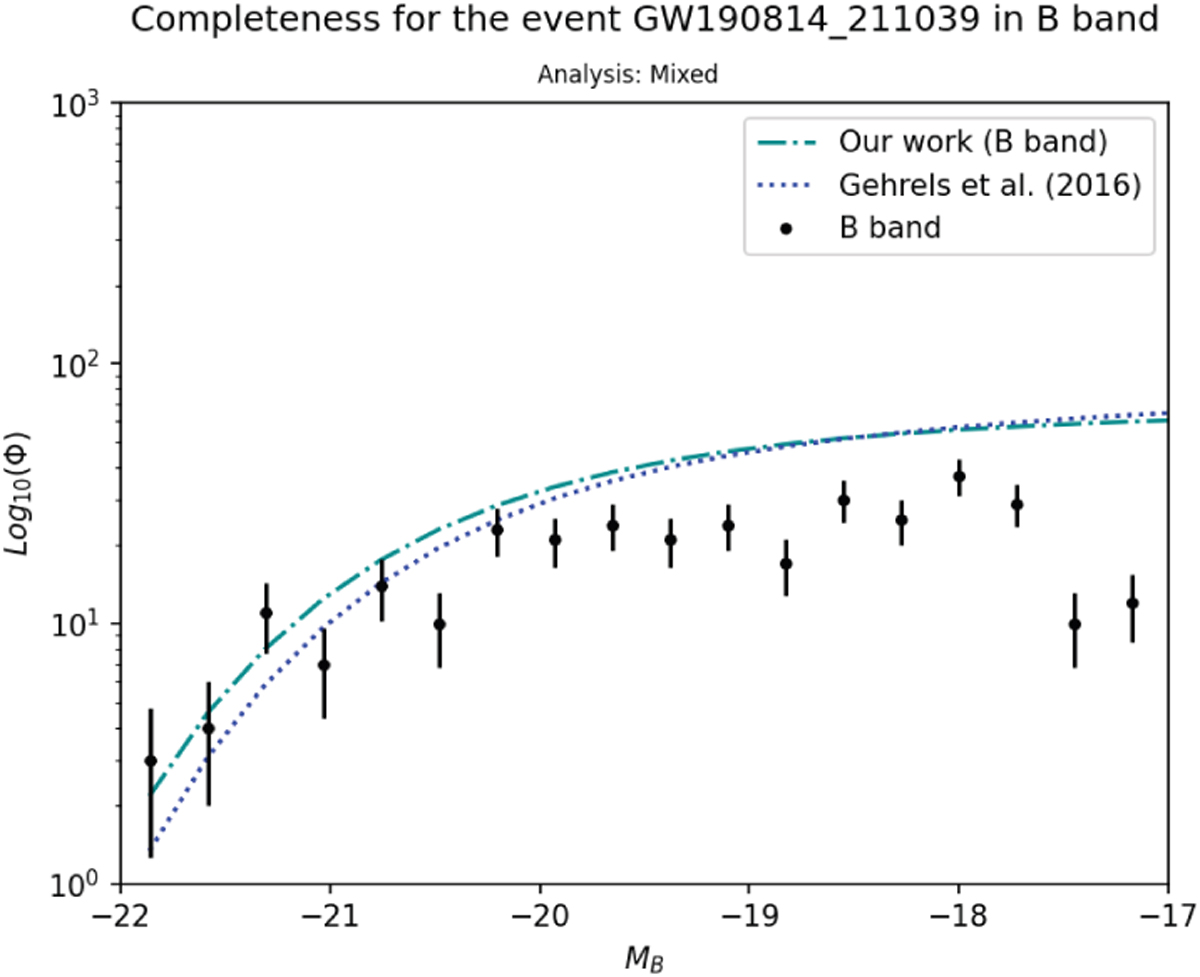
Completeness plot for GW190814_211039. The black dots represent the distribution of the GLADE+ galaxies in the B photometric band within the 90% credible volume. The expected GLADE+ Schechter-function is displayed as a dash-dotted green line and compared with the one from Gehrels et al. (2016) shown with blue dots.
Current usage metrics show cumulative count of Article Views (full-text article views including HTML views, PDF and ePub downloads, according to the available data) and Abstracts Views on Vision4Press platform.
Data correspond to usage on the plateform after 2015. The current usage metrics is available 48-96 hours after online publication and is updated daily on week days.
Initial download of the metrics may take a while.